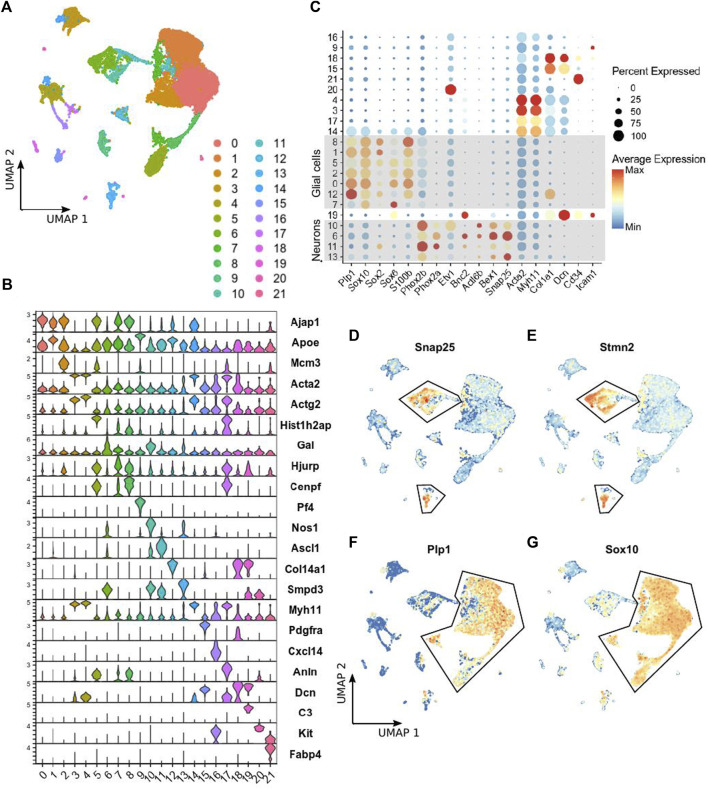
FIGURE 1.
scRNA-seq of LMMP ENS cells from Ednrb −/− mice. (A) UMAP projection showing 22 clusters of cells identified by applying scRNA-seq to tdTomato-positive cells sorted from the LMMP of Ednrb −/− mice. (B) Violin plot showing expression of the top marker gene identified for each cluster identified in (A). (C) Dot plot showing the expression of the indicated genes, including selected glial and neuronal marker genes, in each cluster of cells identified in (A). Dot size indicates the percentage of cells in each cluster with >0 transcripts detected, color indicates the mean level of expression relative to other clusters. (D,E) UMAP projections showing expression levels of the indicated neuronal marker genes in single cells. Outlined cells were considered to be neurons and used for comparison to WT mice. The scalebar for gene expression is the same as in (C). (F,G) UMAP projections showing expression levels of the indicated glial marker genes in single cells. Outlined cells were considered to be glial cells. The scale bar for gene expression is the same as in (C).

