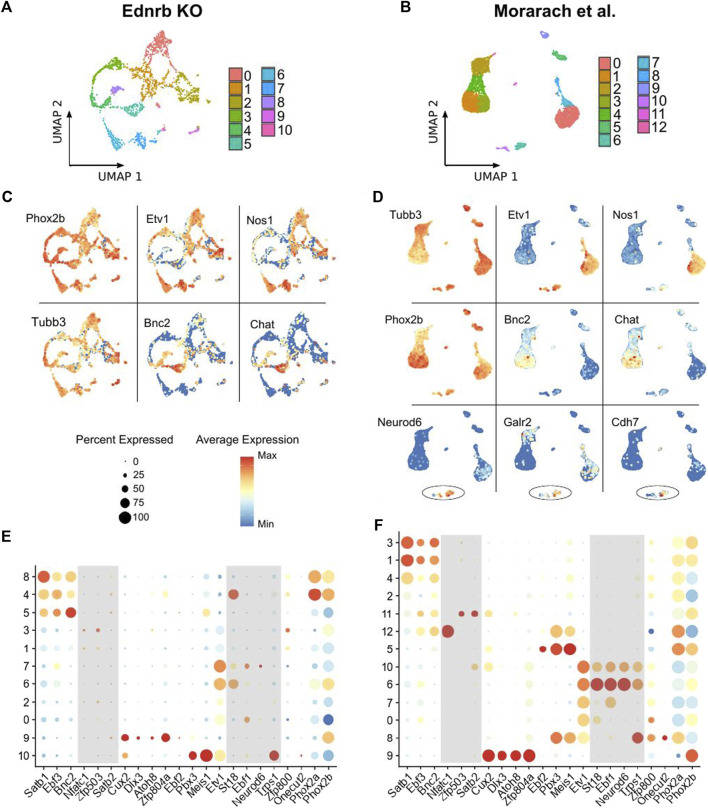
FIGURE 2.
Comparison of scRNA-seq results from Ednrb −/− mice and WT mice. (A,B) UMAP projection showing neuronal clusters identified among the neurons in the Ednrb −/− and WT scRNA-seq datasets. (C,D) UMAP projections showing expression of the indicated genes in the Ednrb −/− and WT scRNA-seq datasets. (E,F) Dot plots showing expression levels of the indicated glial marker genes in either the Ednrb −/− or WT scRNA-seq data. Dot size indicates the percentage of cells in each cluster with >0 transcripts detected, color indicates the mean level of expression relative to other clusters. Shaded boxes denote groups of genes that mark distinct populations in the WT data but not in the Ednrb −/− data.

