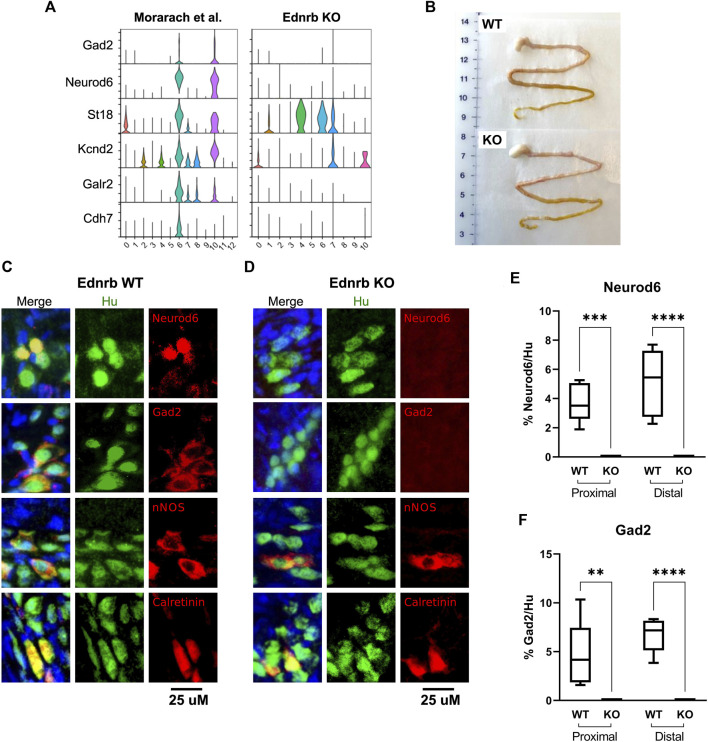
FIGURE 3.
Ednrb −/− mice lack a GABA-ergic neuron population marked by Neurod6 and Gad2 in the SI of WT mice. (A) Violin plots showing expression of the denoted GABA-ergic neuron marker genes in WT and Ednrb −/− SI. (B) Gross appearance of the stomach and SI of WT and Ednrb −/− mice. (C), (D) High-power microscopy images showing immunostaining for the denoted proteins in the SI of WT and Ednrb −/− mice, as indicated. Merge images include DAPI (blue). (E,F) Quantification of the proportion of Hu + neurons in each ganglia that are immunoreactive for Neurod6 or Gad2, as indicated. Box-and-whisker plots indicate mean (horizontal bar), interquartile range (boxes), and range (whiskers). ** indicates p < 0.01, *** indicates p < 0.001, **** indicates p < 0.0001.

