Figure 2.
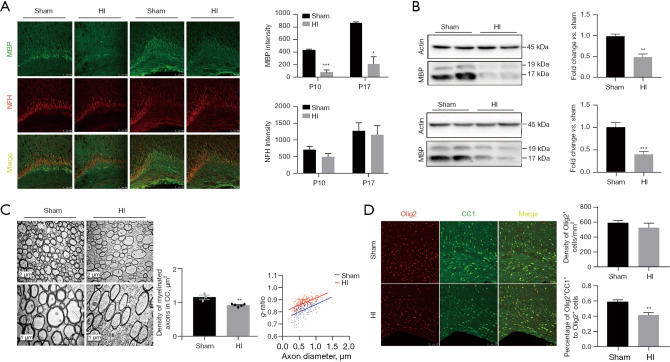
Impaired myelination with arrested oligodendrocyte maturation in the 90-min group. (A) Representative photographs of (green) MBP-NFH (red) co-staining at P10 (left) and P17 (right). Scale bar: 100 µm. (B) Western blot images and quantification of MBP at P10 (upper panel) and P17 (lower panel). (C) Representative electron microscopy photographs at P52. Histograms for the densities of myelinated axons and the g-ratio plotted versus axon diameters of the CC. Scale bar: 2 µm (upper panel), 1 µm (lower panel). (D) External capsule of sham vs. HI mice stained for Olig2 (red) CC1 (green). Olig2+ represents oligodendrocyte lineage cells and Olig2+CC1+ indicate mature oligodendrocytes. Scale bar: 100 µm. n=5–6 mice/group. sham: without HI. *, P<0.05; **, P<0.01; ***, P<0.001. MBP, myelin basic protein; NFH, neurofilament protein heavy chain; HI, hypoxia-ischemia; P10, postnatal day 10; P17, postnatal day 17; CC, corpus callosum; P52, postnatal day 52.

