. 2022 Jul 15;4(4):e210076. doi: 10.1148/rycan.210076

Figure 2:

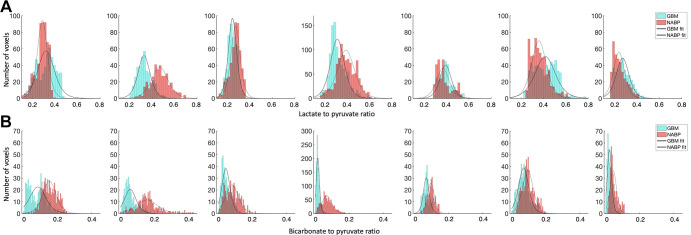
Histograms of the (A) lactate-to-pyruvate and (B) bicarbonate-to-pyruvate ratios in each voxel from the section through the center of the lesion for each patient (n = 7) with an overlying polynomial fit; glioblastoma (GBM) data are shown in blue, and the normal-appearing brain parenchyma (NABP) data are shown in red.

Histograms of the (A) lactate-to-pyruvate and (B) bicarbonate-to-pyruvate ratios in each voxel from the section through the center of the lesion for each patient (n = 7) with an overlying polynomial fit; glioblastoma (GBM) data are shown in blue, and the normal-appearing brain parenchyma (NABP) data are shown in red.