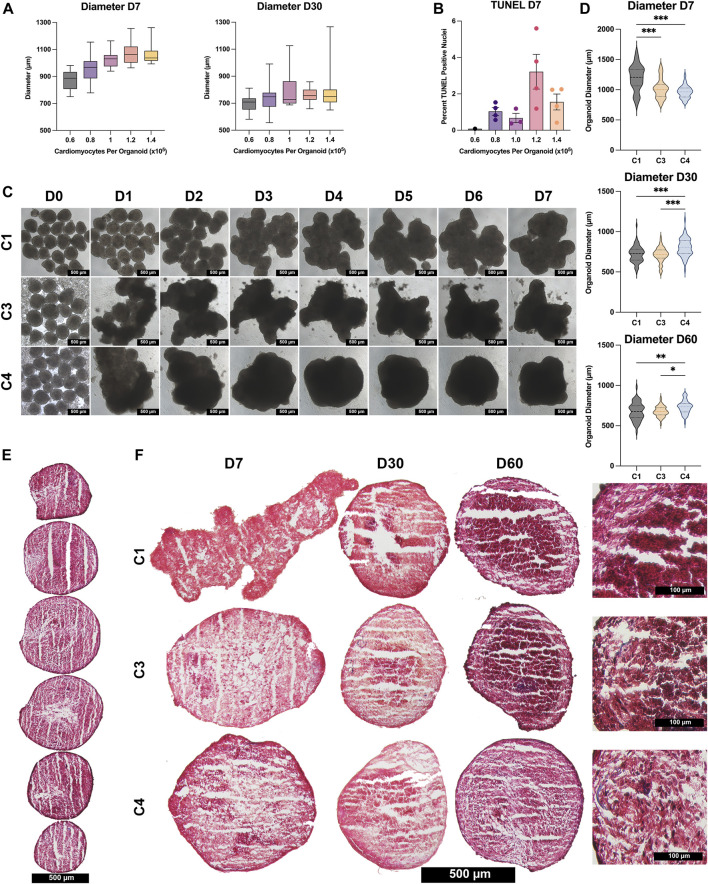
FIGURE 2.
Size and histological assessments. (A) C4 spheroids were generated from the indicated CM population sizes (0.6 × 10⁵ black; 0.8 × 10⁵ purple; 1.0 × 10⁵ pink; , 1.2 × 10⁵ orange; , 1.4 × 10⁵ yellow), and spheroid diameters were measured on D7 and D30; results were displayed as box-whisker plots. (B) C4 spheroids were cut into 10-μm sections, and the sections were stained via terminal deoxynucleotidyl transferase dUTP nick end labeling (TUNEL); then, apoptosis was quantified as the percentage of TUNEL-positive cells in 4 spheroids/group. (C) Images of C1, C3, and C4 spheroids generated from an initial population of 1 × 10⁵ CMs were obtained each day from D0–D7 (bar = 500 μM). (D) Spheroid diameters of all 3 groups (C1 black; C3 yellow; C4 blue) were measured on D7, D30, and D60; results are displayed as violin plots. (E) Spheroids were cut into 10-µm sections and stained with Masson-trichrome; representative images are displayed for every 10th sequential section from a C4 spheroid on D60 (bar = 500 μM). (F) Representative images are displayed for the centermost sections from C1, C3, and C4 spheroids at the indicated time points (bar = 500 μM for the first three columns, and bar = 100 μM for the far-right column); muscle fibers appear red and collagen fibers appear blue. (*p < 0.05, **p < 0.01, ***p < 0.001; n > 30 per group; p-values determined as mean ± SEM).

