FIGURE 3.
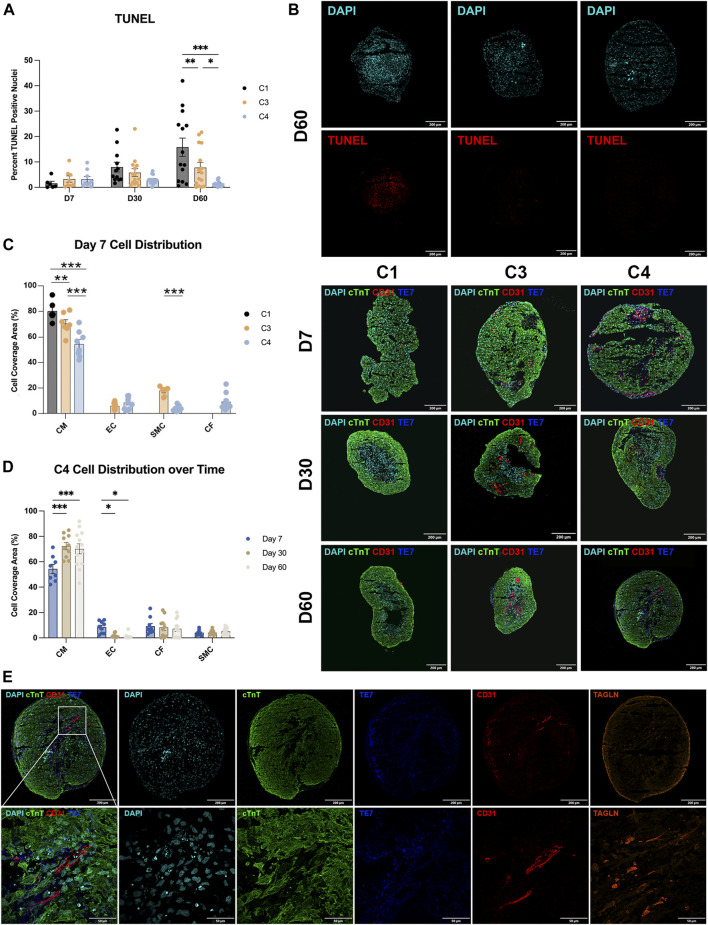
Apoptosis and cell-occupancy measurements. (A) C1, C3, and C4 spheroids were collected at the indicated time points and cut into 10-µm sections; then, the surface areas of every 10th section were measured, and the centermost section (i.e., the one with the largest surface area) was TUNEL-stained. Nuclei were counterstained with DAPI, and apoptosis was quantified as the percentage of TUNEL-positive cells. Representative images are displayed for the centermost sections from each group on D60. (B) Centermost sections were stained with cTnT, CD31, and TE-7 antibodies to visualize CMs, ECs, and CFs, respectively, and nuclei were counterstained with DAPI; representative images are displayed for each group on D7, D30, and D60. (C,D) CM, EC, and CF occupancy were quantified as the percentage of total surface area that was positive for expression of the corresponding marker protein and summarized (C) for C1, C3, and C4 on D7 and (D) for C4 on D7, D30, and D60. (E) Representative sections from a C4 spheroid on D60 are displayed at high magnification to demonstrate the presence of elongated ECs. (*p < 0.05, **p < 0.01, ***p < 0.001; n > 6 per group).

