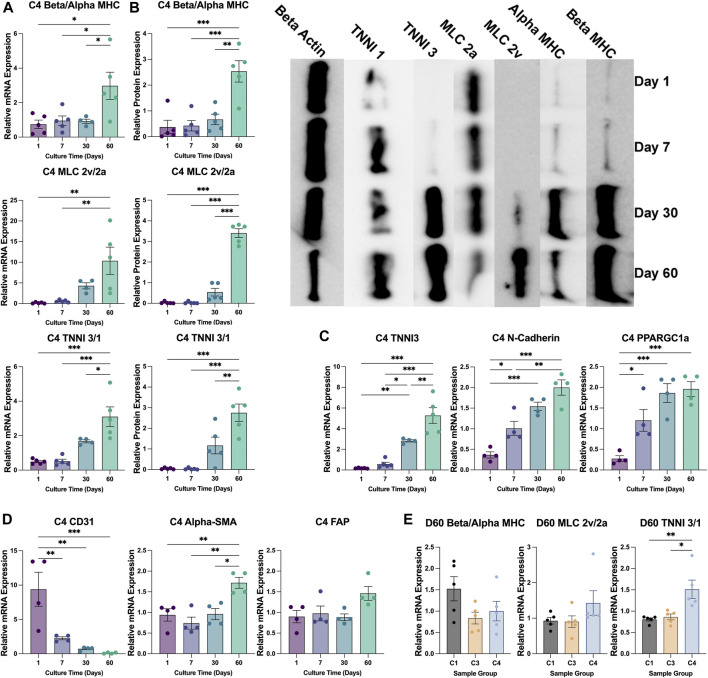
FIGURE 4.
Changes in patterns of gene expression during culture. (A,B) The abundance of beta MHC, alpha MHC, MLC 2v, MLC 2a, TNNI3, and TNNI1 (A) mRNA and (B) protein were evaluated via qPCR and Western blot, respectively, in C4 spheroids at the indicated time points (D1 purple; D7 blue; D30 teal; D60 green); then, the ratios of expression for the MHC (top), MLC (middle), and TNNI isoforms (bottom) were calculated. A representative Western blot of protein expression is displayed on the right of panel (B) (C,D) The abundance of (C) TNNI3, N-cadherin, and PPARGC1a mRNA and of (D) CD31, alpha-SMA, and FAP mRNA was measured via qPCR in C4 spheroids at the indicated time points. (E) The ratios of mRNA abundance for the MHC, MLC, and TNNI isoforms was calculated for C1, C3, and C4 spheroids on D60 (C1 black; C3 yellow; C4 blue). mRNA measurements were normalized to intrinsic GAPDH mRNA abundance, and protein measurements were normalized to intrinsic beta actin abundance. (*p < 0.05, **p < 0.01; n > 4 per group).

