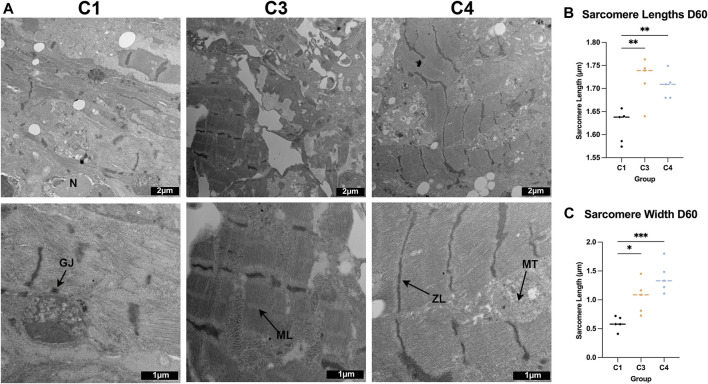
FIGURE 6.
TEM assessments of the ultrastructure of C1, C3, and C4 spheroids. (A) Whole C1, C3, and C4 spheroids on day 60 were sectioned and imaged via TEM (bar = 2 μM for the top row, and bar = 1 μM for the bottom row); ZL: Z-line, ML: M-line, MT: mitochondria, GJ: gap junction, N: nucleus. (B) Sarcomere lengths were calculated by measuring the distance between adjacent Z-lines. (C) Sarcomere widths were measured as the length of each uninterrupted Z-line. (*p < 0.05, **p < 0.01, ***p < 0.001; n > 5 spheroids per group).

