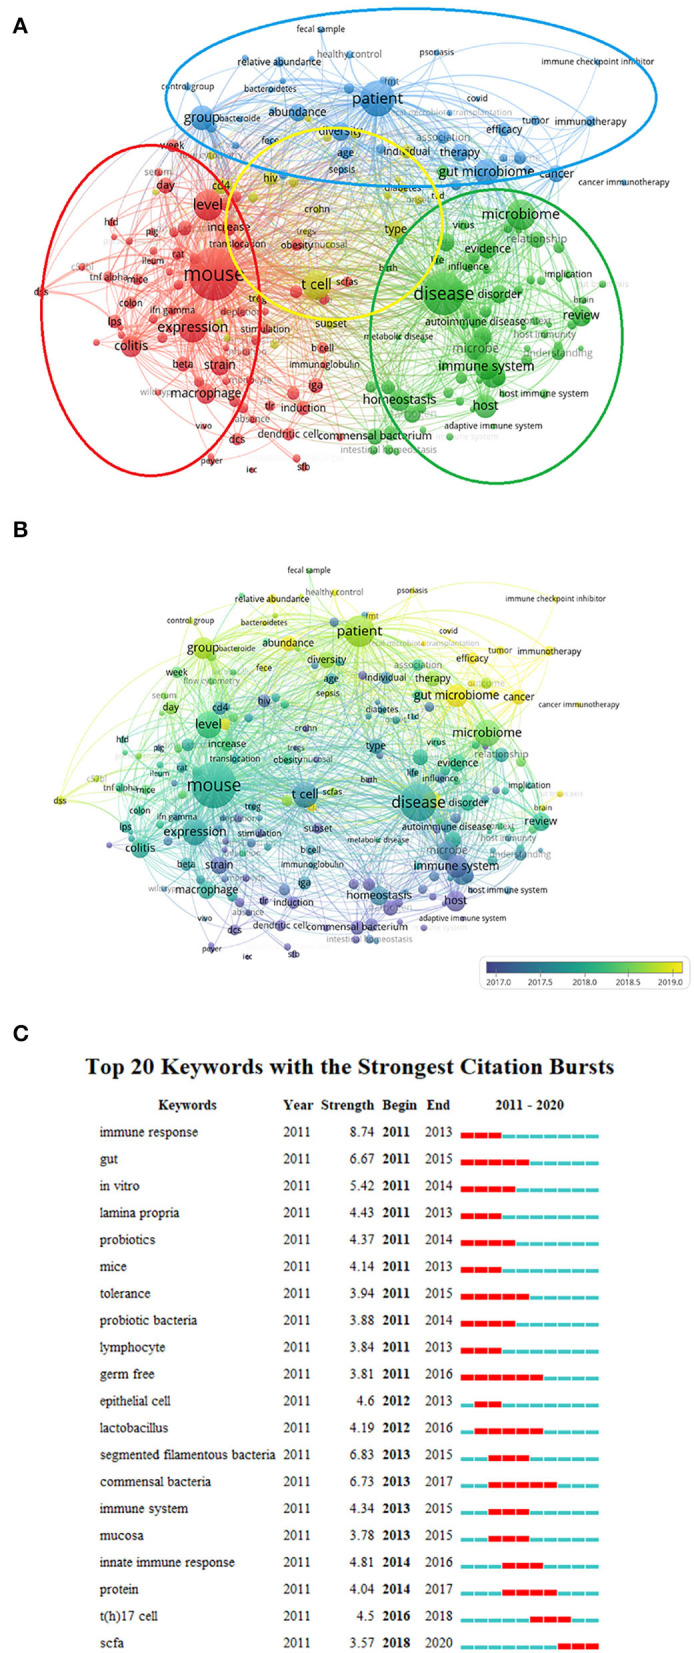
Figure 7.

Co-occurrence analysis of all keywords in the publications on gut microbiota and host immune response: (A) Mapping of the keywords in the field of gut microbiota and host immune response. The size of the circle represents the frequency of keywords, and different colors represent different clusters. (B) Distribution of keywords according to the average time of appearance; blue represents an early appearance, and yellow represents a late appearance. (C) Top 20 keywords cited the most frequently from 2011 to 2020 and have received continuous attention for a period of time. The red bars represent frequently cited keywords during this time period, and the green bars represent infrequently cited keywords.
