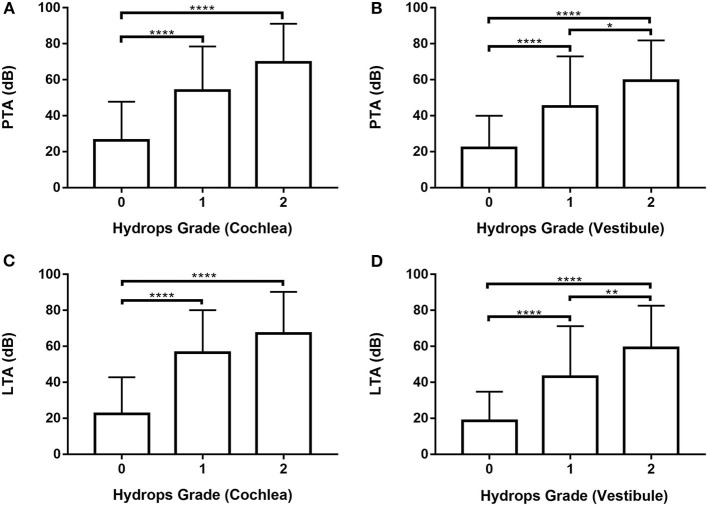
Figure 3.
Analysis of pure tone average (PTA) and low tone average (LTA) according to cochlear and vestibular hydrops grades (0–2) in 246 ears of 123 patients. (A) and (C) One-way ANOVA with Scheffé's post-hoc multiple comparison test. (B) and (D) Welch's ANOVA with Games-Howell's post-hoc multiple comparison test. *p < 0.05; **p < 0.01; ****p < 0.0001.

