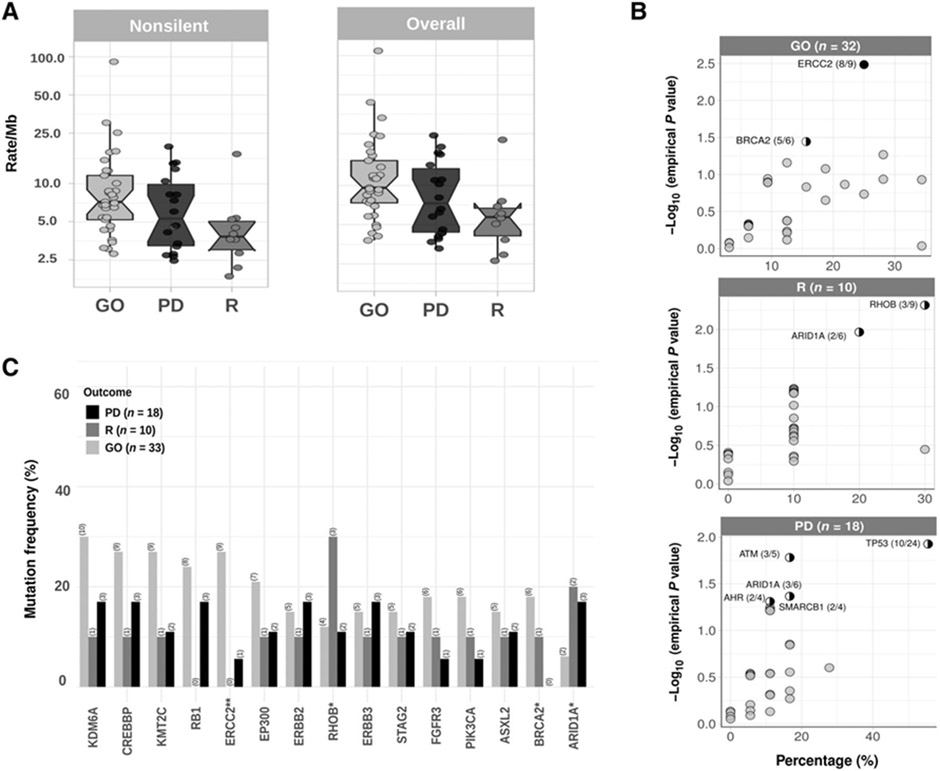
Figure 1.
A, Nonsilent (left) and overall TMB (right) in HGT1-NMIBC. Overall nonsilent TMB good outcome subjects (GO), progressors (PD), and recurrent (R) tumors were 9.6/Mb, 7.3/Mb, and 5.7/Mb, respectively (P = 0.017 by Kruskal–Wallis). B, Outcome association of bladder cancer–related genes (mutated in ≥4 samples). The percentage of samples with nonsilent mutations is shown in the x axis, and the empirical P value (P#) for association with outcome from the random-permutation method (see Materials and Methods), partially correcting heterogeneous mutation burdens among different outcome groups, is shown on the y axis. Black circle, genes with FDR < 0.1; half circle, genes with P value < 0.05. Numbers are the number of mutated samples in the group (GO/R/PD) compared with the total number of samples with mutations in that gene. C, Number of patients with mutations in the 17 SMG grouped by disease outcome (n = 61). ERCC2 is significantly associated with outcome (χ2 test, P < 0.05).

