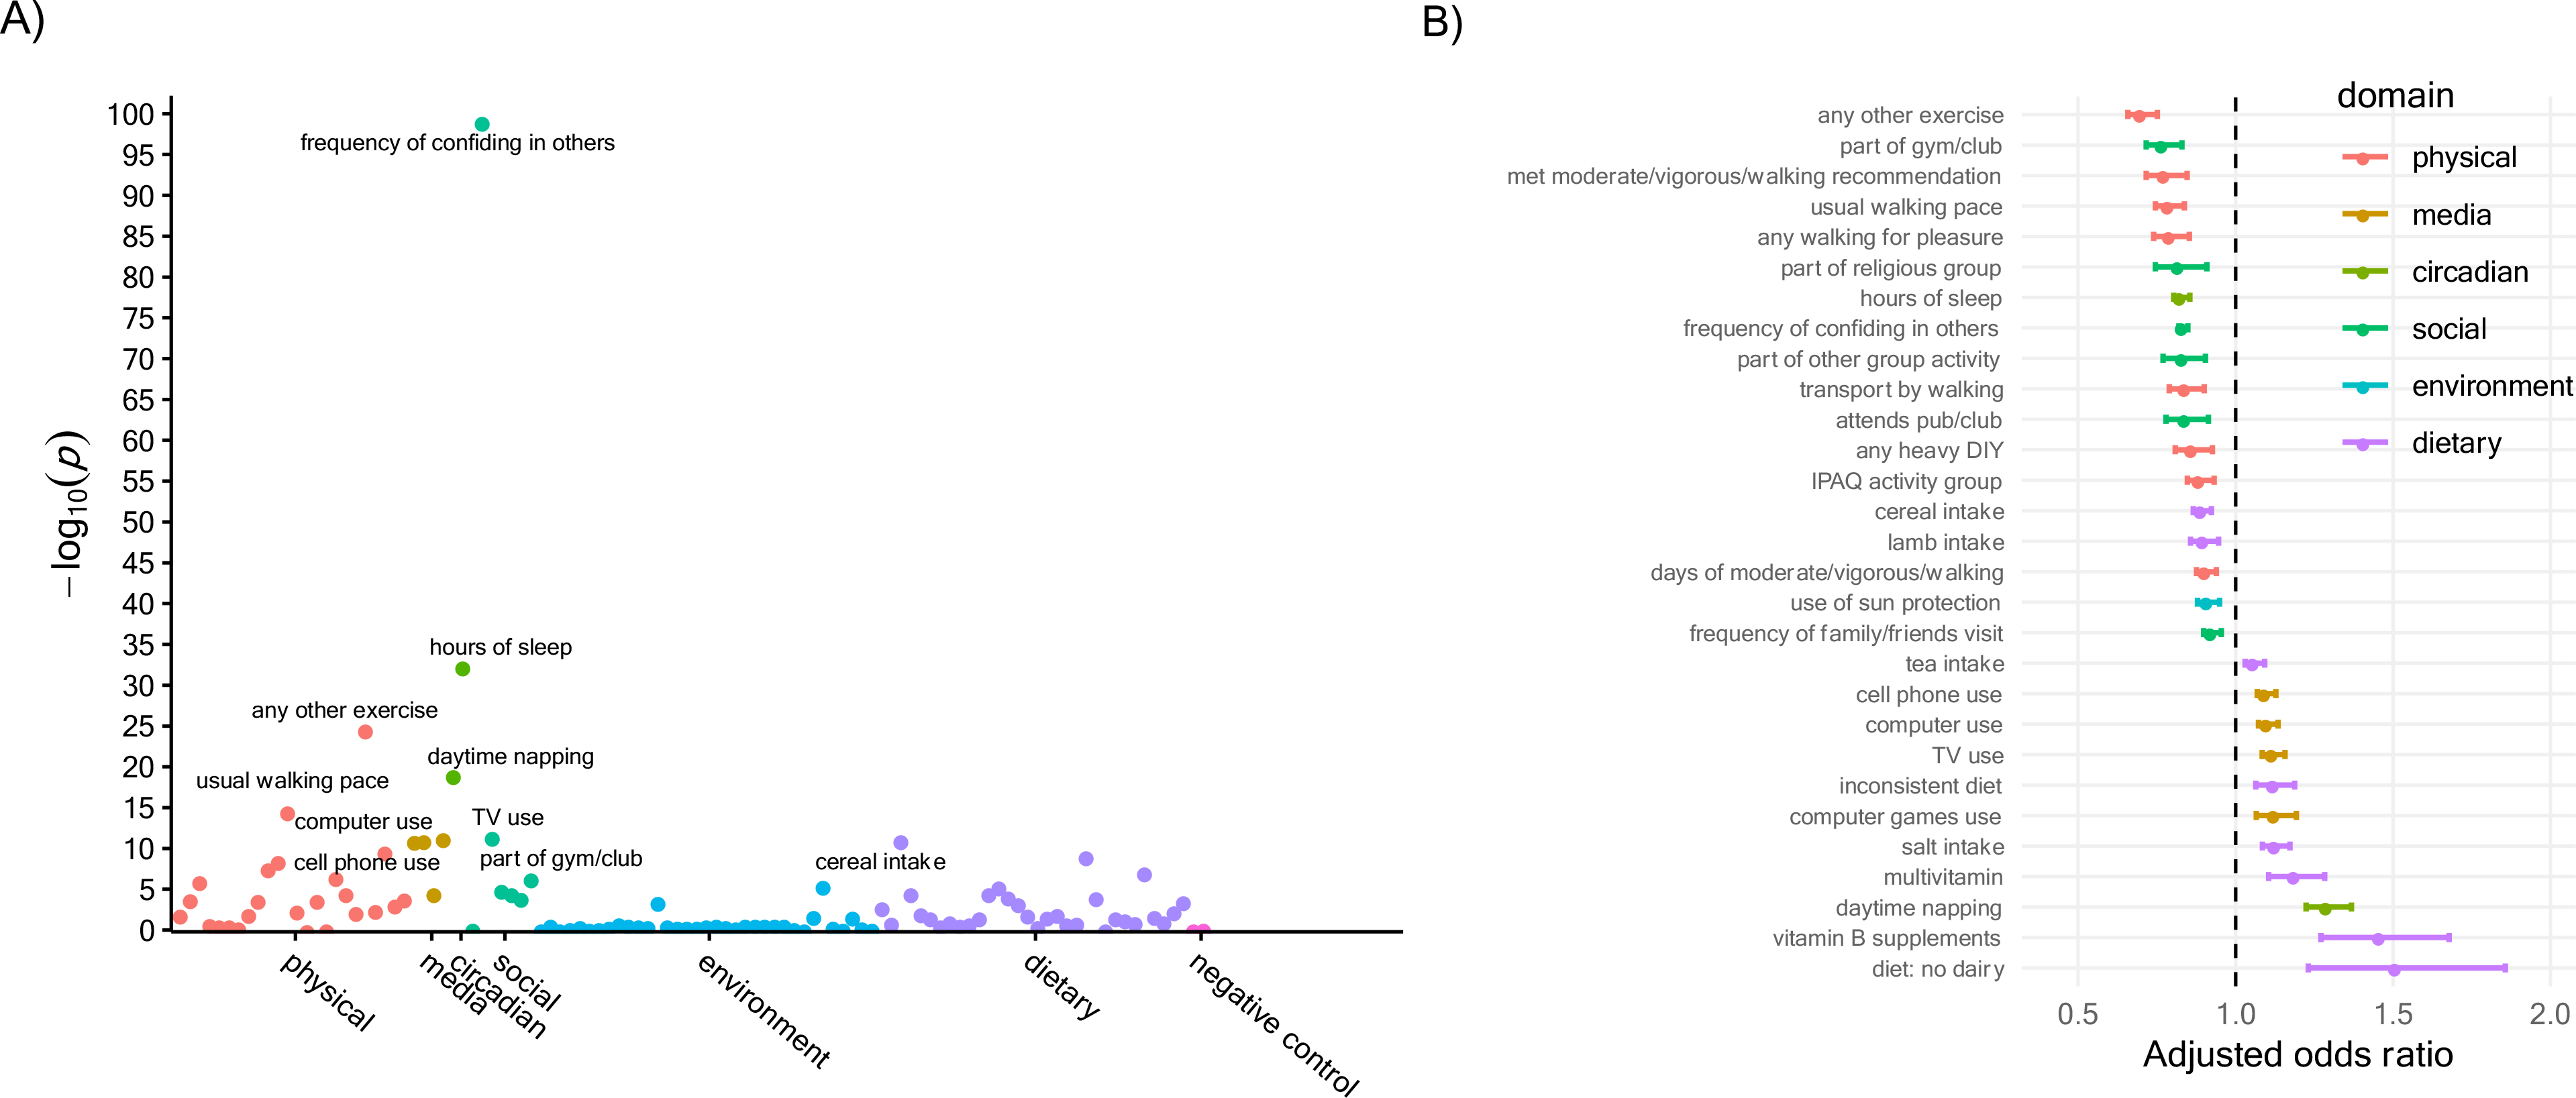
Figure 2. Association results between modifiable factors and clinically significant depression in the full sample, adjusted for sociodemographic and health factors (Model 2).

A) Association plot for modifiable factors in relation to incident depression, with x-axis organized by conceptual domains, y-axis showing statistical significance as −log10 of p-value, and red horizontal line showing the significance threshold corrected for multiple testing. B) Adjusted odds ratios for significant factors, in ascending order (i.e., from risk-reducing to risk-increasing). Full set of association results can be found in Tables S2a–c.
