
Figure 3. Consistency of top associated factors across levels of covariate adjustment.
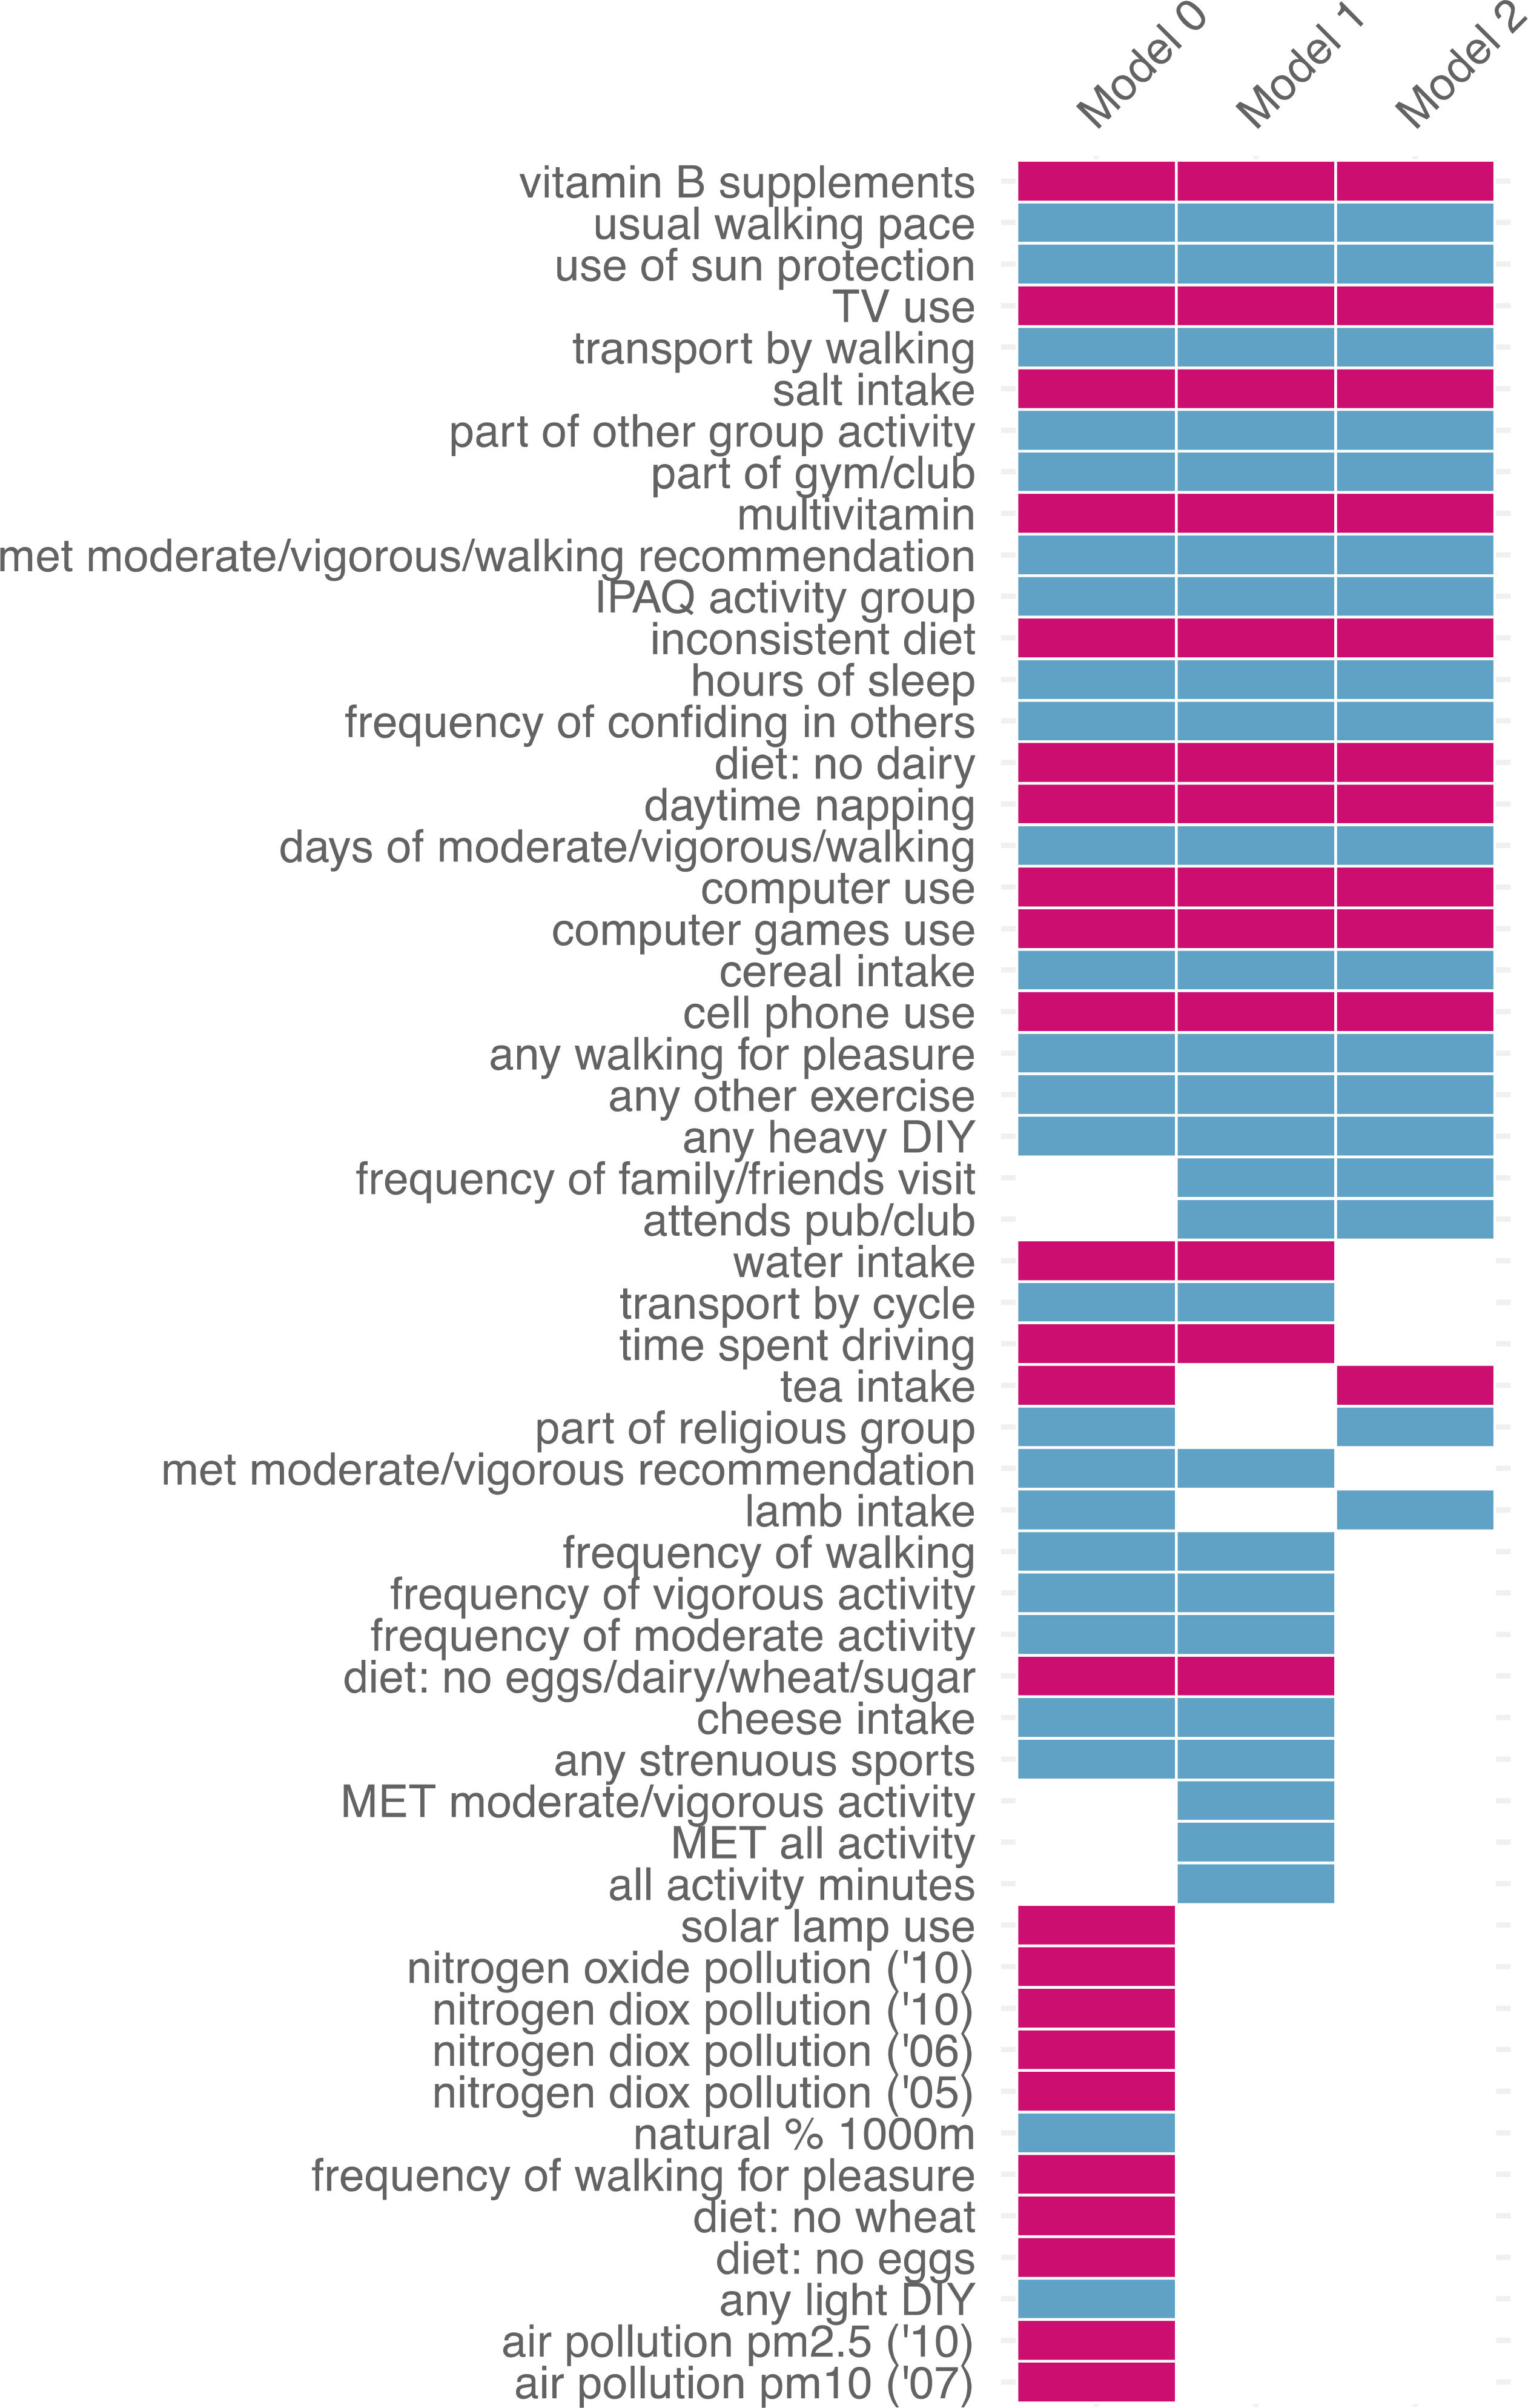
Shown in order of consistency patterns across three, two, or one models, in descending alphabetical order within each pattern. Blue = reduced odds of depression; red = increased odds of depression. Results shown only for factors with significant associations in at least one model. Full set of association results can be found in Tables S2a–c.