
Figure 2:
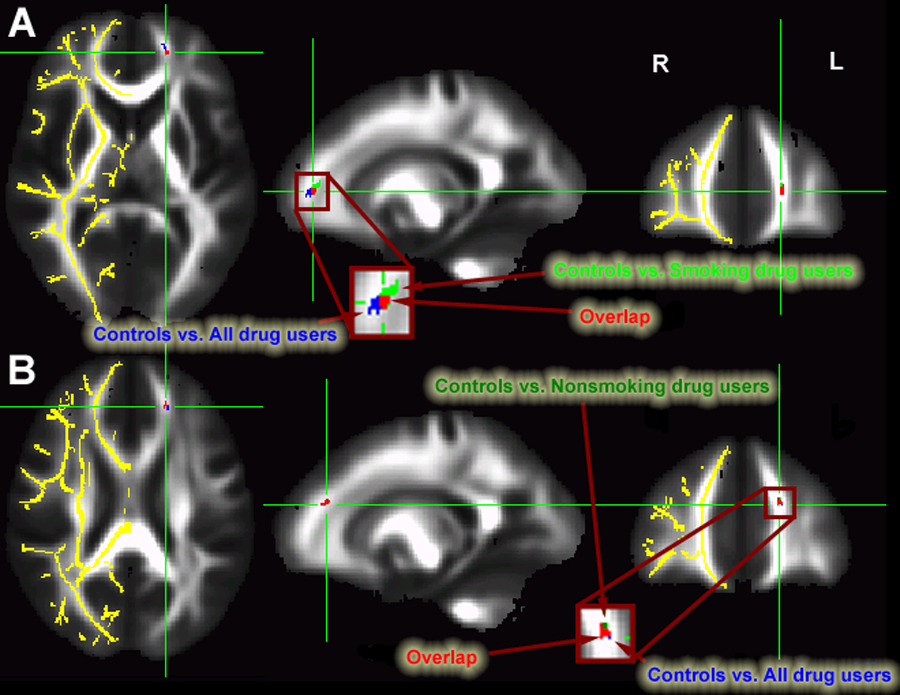
PFC regions (blue) showing significant interaction between COMT gene and addiction status A) PFC #1 showing overlap (red) between controls vs. all drug users (blue) and controls vs. smoking drug users (green); B) PFC #2 showing overlap (red) between controls vs. all drug users (blue) and controls vs. nonsmoking drug users (dark green). Localization of FA differences are projected onto a white matter skeleton (shown in YELLOW on the right hemisphere).