
Figure 3:
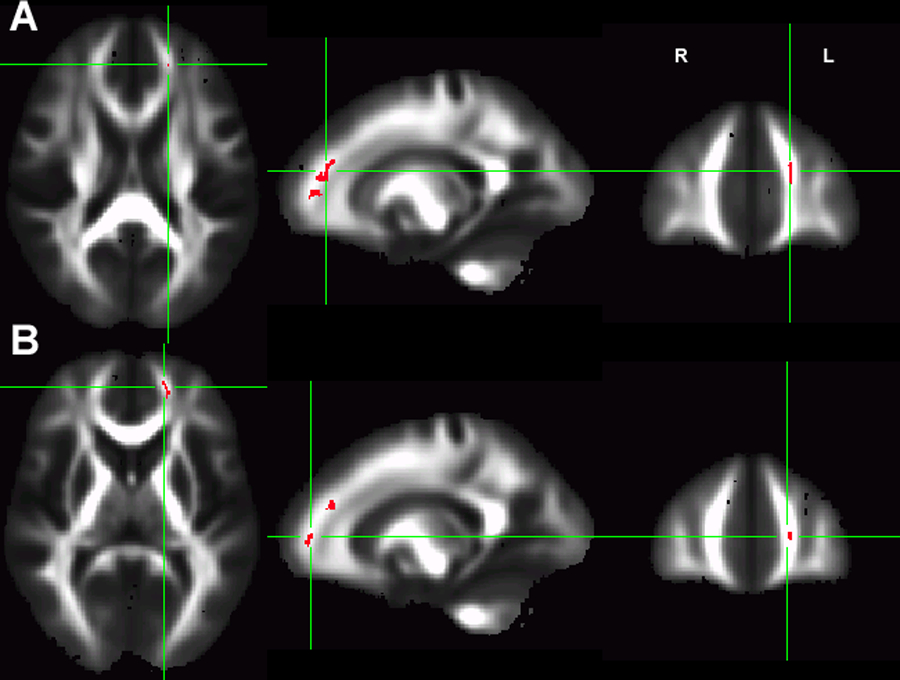
The whole brain comparison between drug users and controls in Met/Met alleles. The Met/Met drug users have significant lower FA than the Met/Met controls in two prefrontal clusters (A: volume=82mm3, MNI coordinates: L18.1, A39.7, S19.5, pcorrected=0.008; B: volume=55mm3, MNI coordinates: L17.5, A47.9, S6.7, corrected p=0.019).