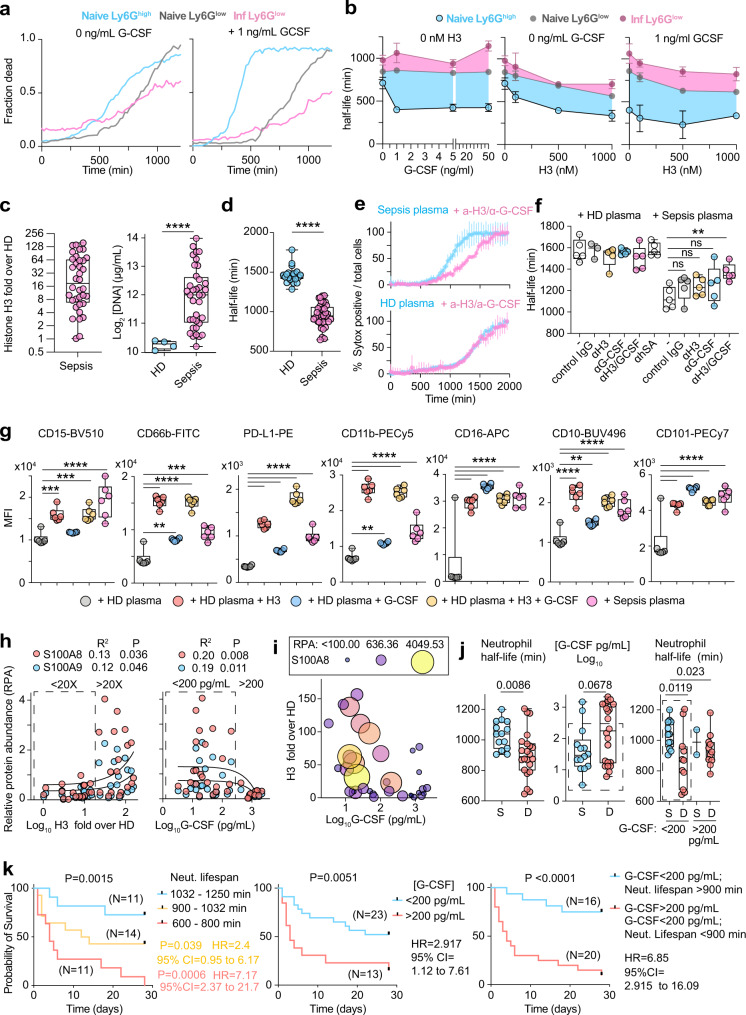
Fig. 10. Histones and G-CSF shorten mature neutrophil lifespan selectively.
a Representative neutrophil death time-courses of Ly6Ghigh (blue) and Ly6Glow (grey) BM neutrophils sorted from naïve WT mice and Ly6Glow cells (pink) from the BM of symptomatic WT mice infected with C. albicans in the absence or in the presence of 1 ng/mL G-CSF (Representative of 2 independent experiments. b Effect of recombinant histone H3 and G-CSF alone or in combination, on mature and immature neutrophil half-life curves for Ly6Ghigh (black) naive Ly6Glow (grey) and infected Ly6Glow (pink). Differences between curves are highlighted by coloured windows. Each point is the average half-life from three separate field measurements. c Fold increase over 4 healthy donors (HD) in histone H3 in the plasma of 36 human patients with bacterial sepsis, quantified from western immunoblots (left). DNA concentrations in the plasma of 4 HDs and 36 sepsis patients (right). d Half-life HD blood neutrophils incubated with plasmas from 22 HDs (blue) or 36 sepsis patients (pink). Representative of two independent experiments. e Representative cell death curves of HD neutrophils incubated with HD (lower) or sepsis patient plasma (upper) in the presence of a control or anti-histone H3 and anti-G-CSF antibodies. Average and SD for 4 FOV per condition. f Quantification of the half-life of HD neutrophils incubated with either HD (n = 5 donors) or sepsis patient (n = 5 donors) plasmas alone or in combination with anti-histone H3 or anti-G-CSF antibodies (3 FOV per donor). g Quantification of the mean fluorescence intensity (MFI) of surface markers in HD neutrophils incubated with HD or sepsis patient plasma alone or HD plasma supplemented with histone H3 or G-CSF, measured by flow cytometry. Each dot corresponds to a different plasma donor (n = 6). Panel: CD15-BV510, CD66b-FITC, PD-L1-PE, CD11b-PECy5, CD16-APC, CD10-BUV496, CD101-PECy7. Representative of two independent experiments. h Correlation between the fold-increase in sepsis patient plasma histone H3 (left plot) or G-CSF (right plot) and the relative abundance of S100A8 (red) and S100A9 (blue) measured by mass spectrometry. Boxes depict medium and high histone H3 containing plasmas. i Correlation between plasma G-CSF and histone H3 levels in sepsis patient plasmas. Dot sizes and colours are relative to plasma S100A8 levels. j Half-life of HD neutrophils incubated with plasmas from survivors (S) or deceased (D) sepsis patients (left), plasma G-CSF levels (middle) and neutrophil lifespan shortening activity in plasmas segregated into high (>200 pg/mL) and medium (dotted box, <200 pg/mL) G-CSF levels (right). k Survival curves of sepsis patients segregated into high (red), medium (yellow) and low (blue) neutrophil lifespan shortening activity (left), patients with high (red) and medium (blue) G-CSF levels and patients with medium G-CSF with low neutrophil lifespan shortening activity (blue) or high G-CSF and medium G-CSF with high neutrophil lifespan shortening activity (red) (right). Statistical analysis by simple linear regression, unpaired two-sided Mann–Whitney or parametric t-test and two-sided Log-rank (Mantel–Cox) test for survival analysis (*p < 0.05, **p < 0.01, ***p < 0.001, ****p < 0.0001).

