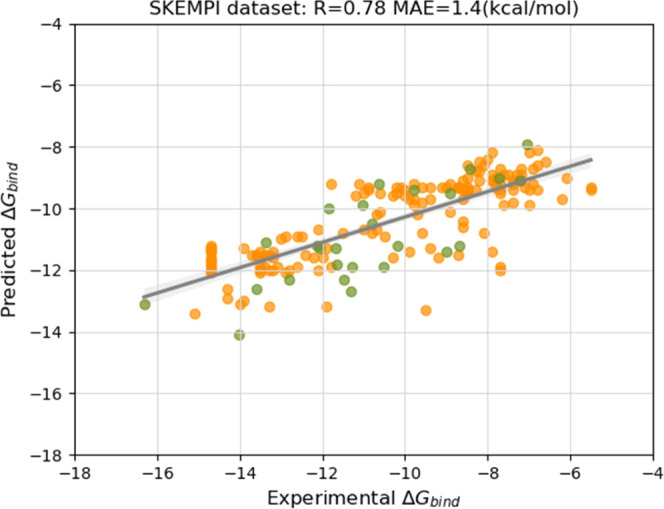
Figure 3.

Performance of PPI-Affinity on the test set of 26 wild-type complexes and 151 mutants of protein–protein affinity data points taken from the SKEMPI dataset. The performance is reported as the Pearson’s correlation coefficient (R) between experimental and predicted BA. The green points correspond to BA values of the wild-type complexes, and the orange points correspond to the BA values of the mutants.
