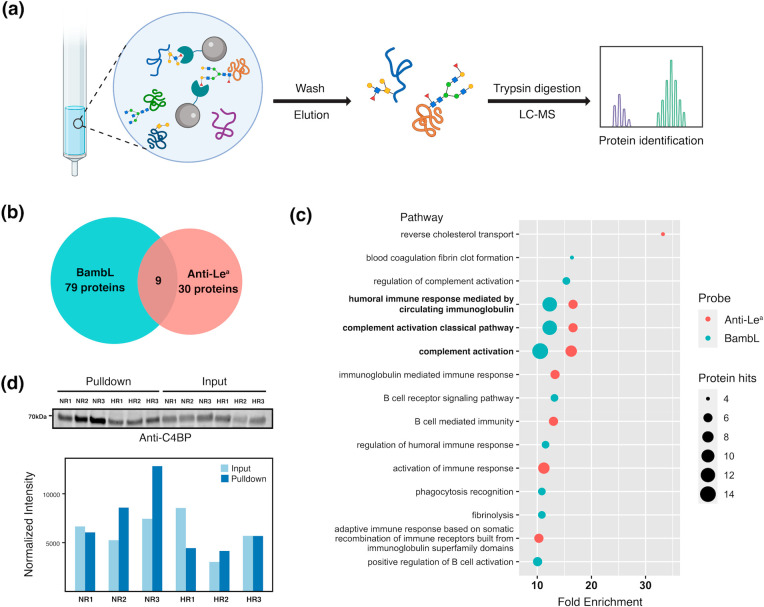
Figure 3.
(a) Scheme of the experimental approach of glycoproteomic analysis. (b) Number of glycoproteins identified in BambL/anti-Lea pulldown experiments. (c) Gene ontology pathway enrichment analysis for glycoproteins enriched with BambL/anti-Lea. The false discovery rates (FDRs) of the enriched pathways shown are all <0.05. (d) Differential C4BP glycosylation. Western blot analysis for C4BP of BambL pulldown samples and corresponding input for three high responders (HR1, HR2, and HR3) and three nonresponders (NR1, NR2, and NR3) are shown. Signal intensities of the bands (normalized to total protein stain) are depicted in the bar plot.

