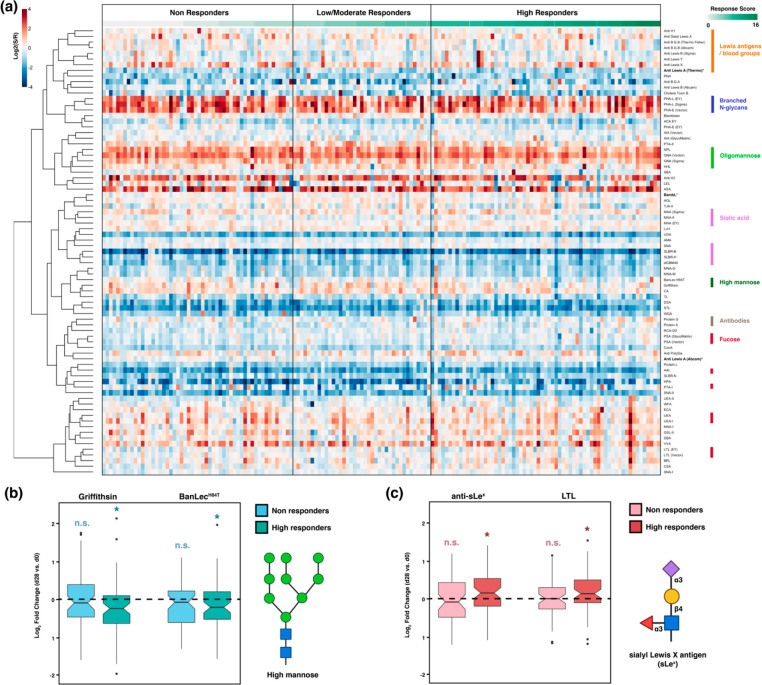
Figure 5.
(a) Heatmap of lectin microarray data for postvaccination (day 28) serum samples. Columns represent the participants and rows represent the probes. Shown is the normalized log2 ratios (Sample signal (S)/Reference signal (R)). Total response scores are annotated with a green-white sliding scale bar on the top of the heatmap. Rough specificities of select lectins are annotated on the right of the heatmap. (b,c) Boxplots of log2 fold-change for paired d28 and d0 samples in non- and high responders. (b) High-mannose binding lectins (Griffithisin and BanLecH84T). (c) Sialyl Lewis X binding probes (Anti-sLex). Paired Mann–Whitney U test was used to determine p-values. n.s.: not statistically significant (no difference is observed d28/d0); (*) p < 0.05. Glycans are shown in SNFG notation at the side of the boxplots. Symbols are defined as follows: galactose (yellow ●), N-acetylglucosamine (blue ■), mannose (green ●), sialic acid (purple ◆), fucose (red ▲).

