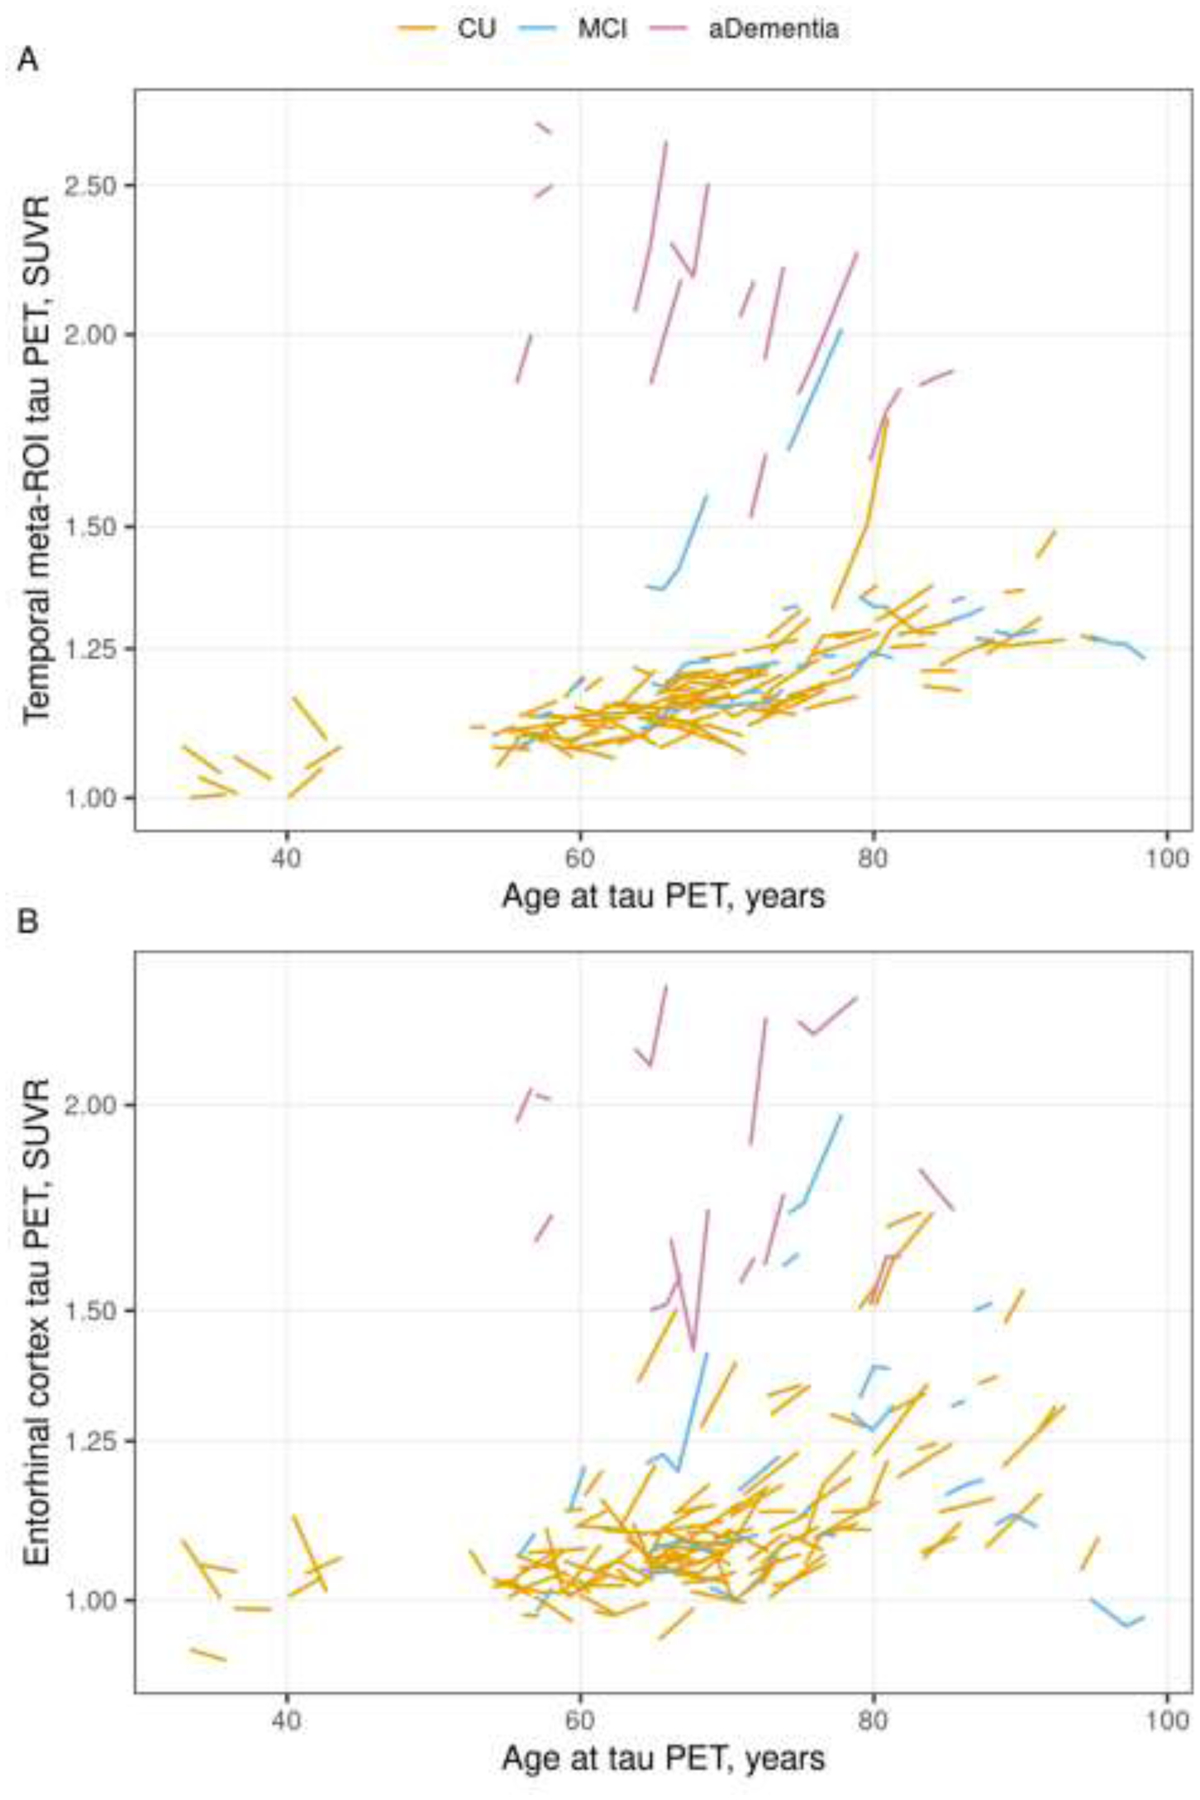
Figure 2 (color figure).

Individual tau PET trajectories by age. Tau PET trajectories within each participant for the temporal meta-ROI (Panel A) and entorhinal cortex (ERC, Panel B) regions by age colored by clinical diagnosis (orange = cognitively unimpaired [CU], blue = mild cognitive impairment [MCI], pink = amnestic dementia [aDementia]). Tau PET is shown on the logarithmic scale.
