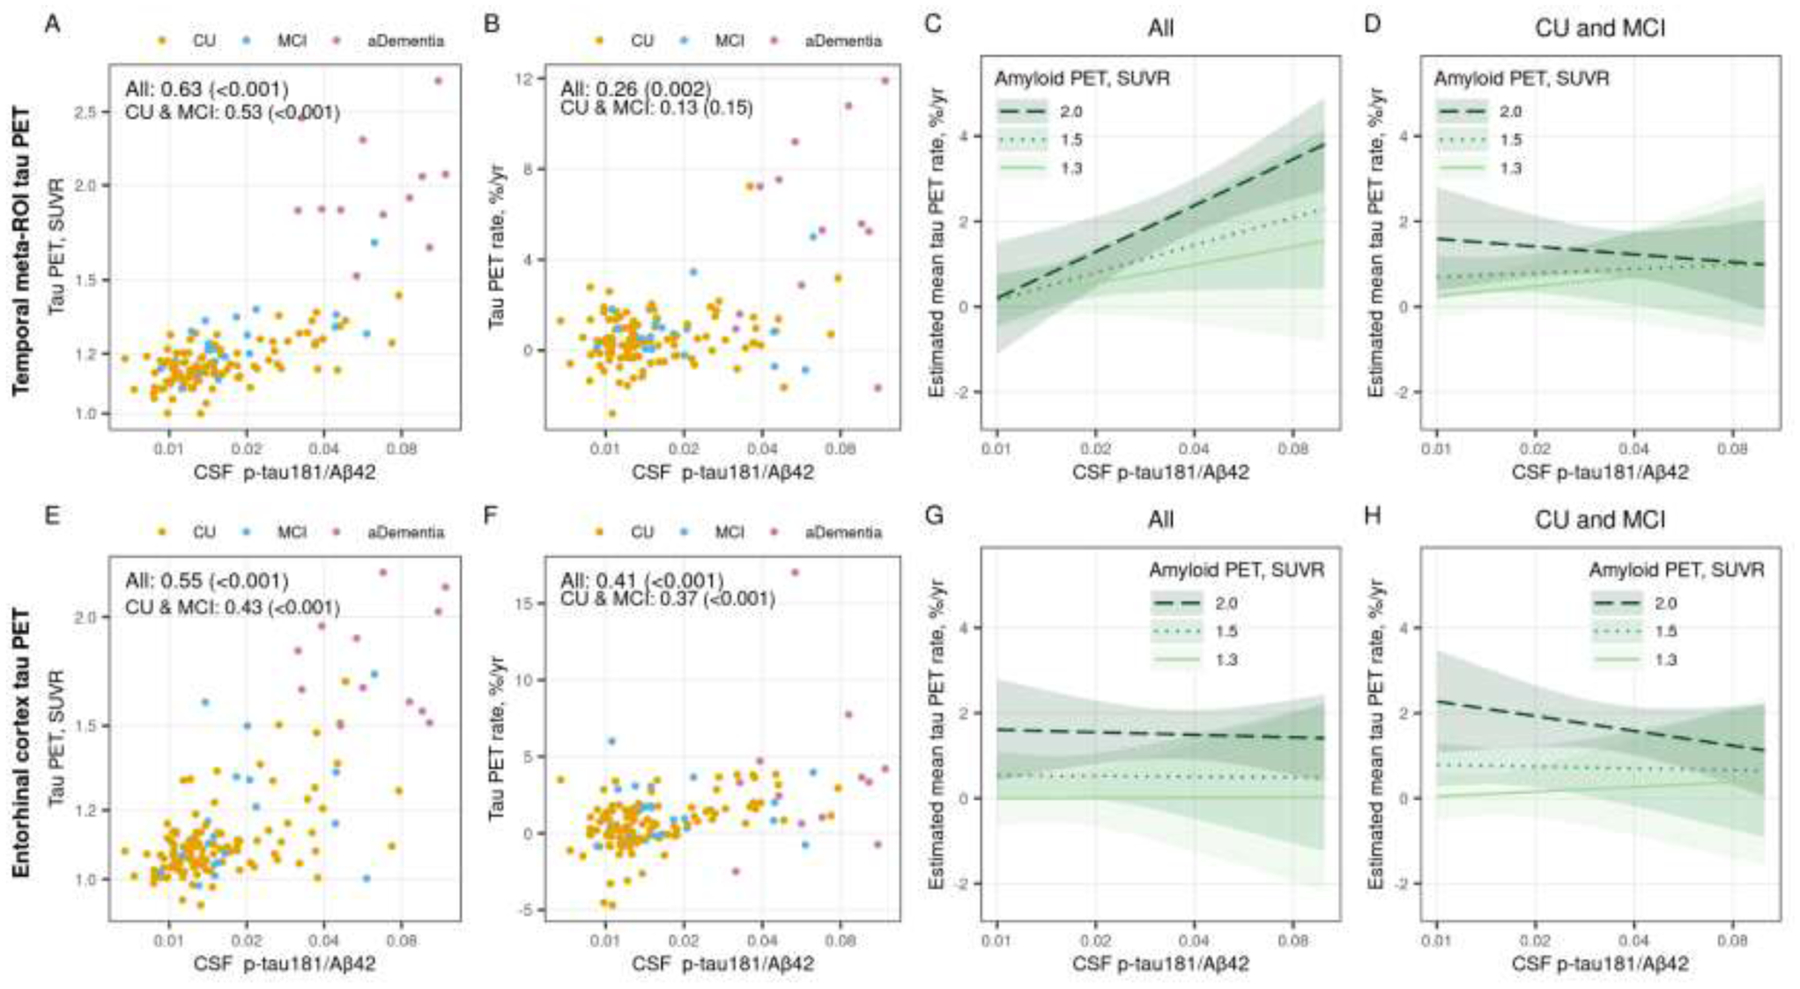
Figure 5 (color figure).

Associations between the CSF p-tau181/Aβ42 ratio and temporal meta-ROI (top row) and entorhinal cortex (ERC, bottom row) tau PET. Scatter plots of CSF p-tau181/Aβ42 versus baseline tau PET SUVR (panel A and E) and annual percent change in tau PET (panel B and F) are shown with points colored by clinical diagnosis (orange = cognitively unimpaired [CU], blue = mild cognitive impairment [MCI], and pink = amnestic dementia [aDementia]). Spearman correlations, rho (p-value), are shown as a measure of the strength of association among all participants and within the subset of participants who were cognitively unimpaired (CU) or had mild cognitive impairment (MCI). Panels C, D, G, and H show the estimated mean (95% confidence interval) annual percent change in temporal meta-ROI and ERC tau PET by CSF p-tau181/Aβ42 for three exemplar amyloid PET SUVR values. Estimates are from a linear mixed effects model fit among all participants (panels C and G) and fit among the subset of CU and MCI participants (panels D and H). The models included log-transformed tau PET SUVR as the outcome and years from first tau PET scan, age, sex, and log-transformed CSF p-tau/Aβ42 as predictors. The model included the duration from CSF draw to first tau PET scan to adjust for any delay between the measurements. The model also included participant-specific random intercepts and slopes. The model was parameterized to allow covariate associations with initial tau PET SUVR and change in tau PET (i.e. interactions with time). The model also included an interaction with CSF p-tau181/Aβ42 and amyloid PET SUVR. Estimates are shown for a hypothetical 70-year-old male with no delay between CSF draw and first tau PET scan.
