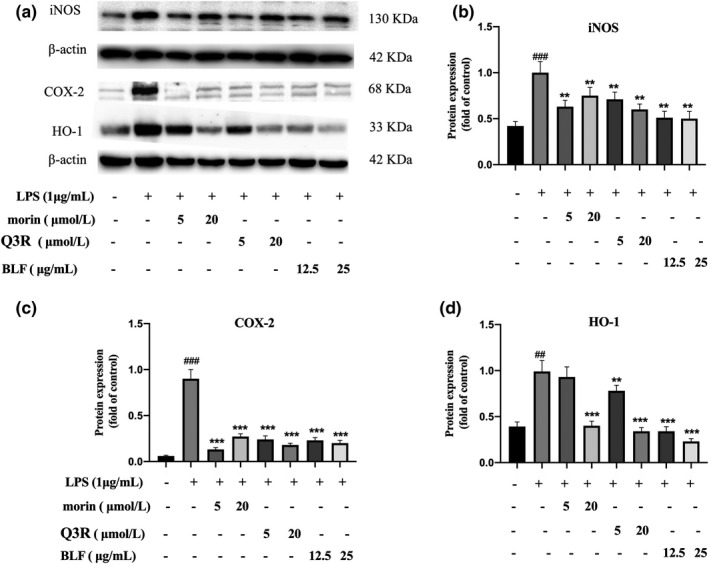
FIGURE 5.

Protein expression levels of iNOS, COX‐2, and HO‐1 of the RAW264.7 cells. (a) The protein bands photograph of the RAW264.7 cells. (b) Relative protein expression of iNOS for the RAW264.7 cells. (c) Relative protein expression of COX‐2 for the RAW264.7 cells. (d) Relative protein expression of HO‐1 for the RAW264.7 cells. ##p < .01, ###p < .001 in comparison with untreated cells. **p < .01, ***p < .001 in comparison with LPS‐treated cells
