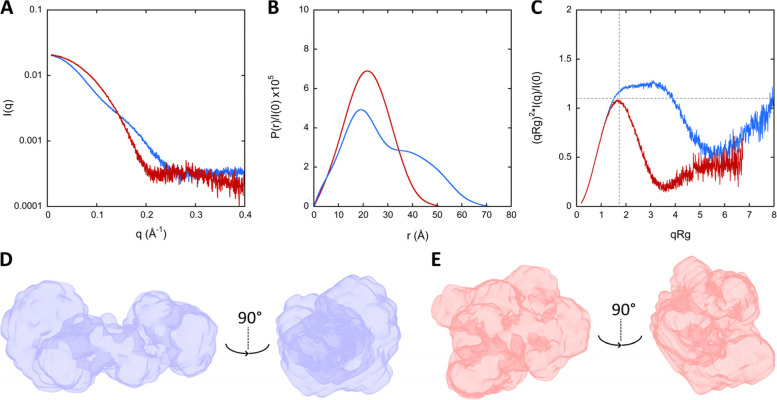
Fig. 1.
SAXS patterns and DENSS analysis of holo-CaM in the absence and in the presence of CDZ. A Scattering patterns of holo-CaM (blue trace) and holo-CaM:CDZ complex (red trace). B Distance distribution function P(r) of holo-CaM in the absence and in the presence of CDZ using GNOM, same color code as in panel A. C Dimensionless Kratky representation of holo-CaM in the absence and in the presence of CDZ, same color code as in panel A. Dash lines crossing x-axis (√3) and y-axis (1.104) indicate the characteristic peak for globular proteins. D, E DENSS models of holo-CaM and holo-CaM:CDZ, respectively

