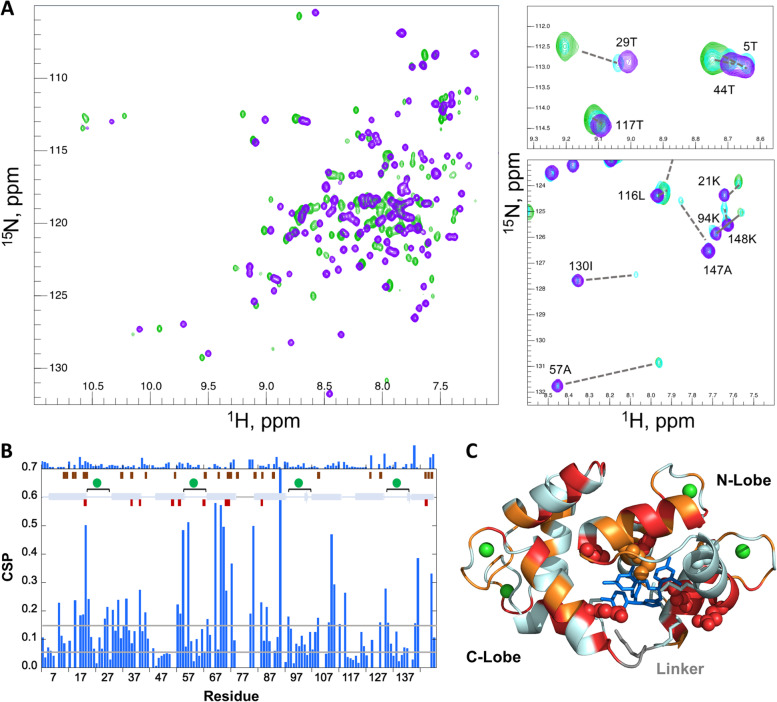
Fig. 4.
CDZ binding monitored by CaM 1H-15N chemical shift perturbation (CSP). A (left) 1H-15N SOFAST full fingerprint spectra (recorded at 37 °C) of holo-CaM alone (mauve) and in the presence of 1.0 equivalent of CDZ (green). (right) Zoom on two selected regions of the fingerprint spectra. The spectrum of holo-CaM in the presence of 0.5 equivalents (cyan) is also displayed. The assignments of free holo-CaM are shown and the dotted lines indicate the corresponding signal in the 1:1 holo-CaM:CDZ sample. B CSP values of 1 CDZ equivalent added to holo-CaM as a function of the residue number. The secondary structure (helix=cylinder, strand=arrow), calcium binding loops (spheres and square brackets), and linker region (grey line) are schematized. The CSP values between the 1:1 and 1:2 holo-CaM:CDZ complexes are displayed on the top of the panel, respecting the same scale. The positions of contacting residues in the X-ray 1:1 and 1:2 holo-CaM:CDZ complex structures are represented by wine and maroon rectangles, respectively. Grey lines represent the CSP values chosen as thresholds for very strong and strong CSPs. C Residues with very strongly perturbed (red, CSP ≥ 0.14) and strongly perturbed (orange, 0.07 ≤ CSP < 0.14) amide resonances are highlighted on the cartoon representation of the 1:1 holo-CaM:CDZ x-ray complex structure. CDZ is shown as blue sticks and Ca2+ ions as green spheres. The side chains of the CaM residues in close contact with CDZ as defined by Ligplot+ are highlighted as spheres if assigned (19, 36, 39, 54, 63, 71, 84) or as sticks (51, 72, 76, 77, and 145) if not observed by NMR. Amide resonances of the following residues were not assigned in the holo-CaM:CDZ complexes: 8, 12, 14, 16, 38, 51–52, 72, 75–79, 82–83, 88, 92, 106–107, 112, 114, 124, 126–127, 129–130, 139, 143-146

