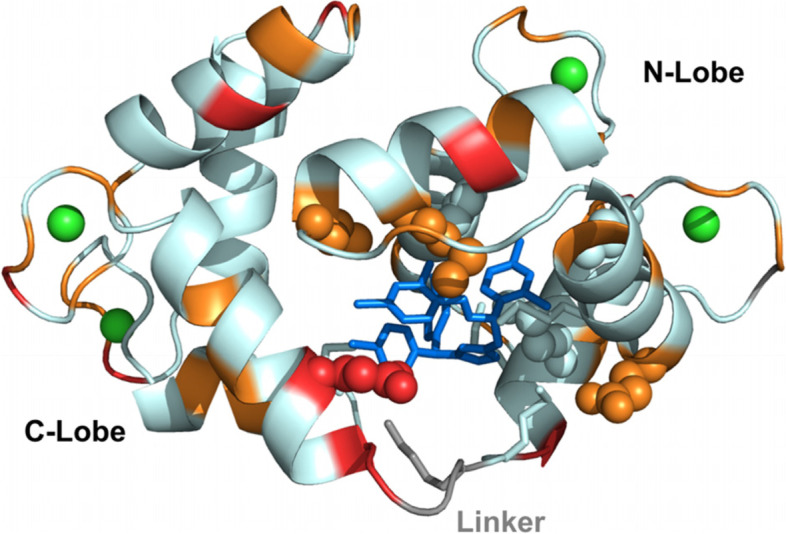
Fig. 5.

Decrease of backbone amide internal motion amplitudes in the nanosecond-picosecond time scale of holo-CaM upon binding to CDZ. The difference of the heteronuclear 1H-15N nOe of CDZ bound and free holo-CaM is color-coded on the cartoon representation of the holo-CaM:CDZ 1:1 X-ray structure. Red indicates very high positive nOe differences (≥ 0.18) and orange high nOe differences (between 0.10 and 0.16), denoting a decrease in the amplitude of fast internal motions (ns-ps) in the complex. CDZ is shown as blue sticks, Ca2+ ions are displayed as green spheres and the linker residues are shown in grey. The side chains of the CaM residues in close contact with CDZ as defined by Ligplot+ are highlighted as spheres if assigned (19, 36, 39, 54, 63, 71, 84) or as sticks (51, 72, 76, 77, and 145) if not observed by NMR
