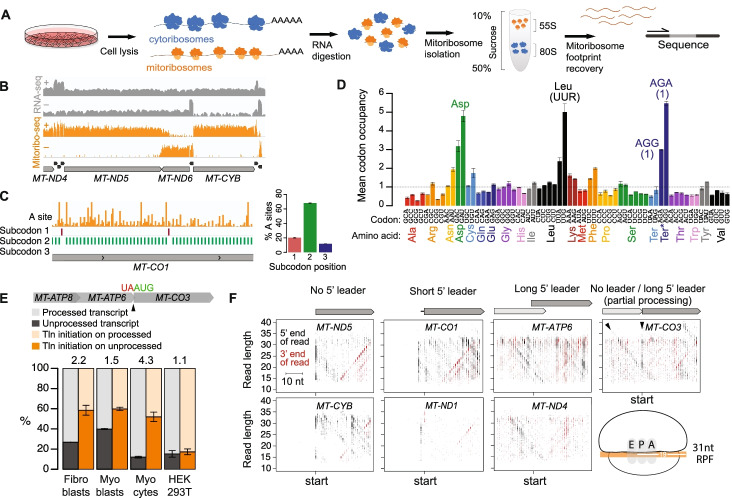
Fig. 1.
Human mitoribosome profiling reveals features of mitochondrial translation. A Schematic of the human mitoribosome profiling approach. B Sequencing data over a representative portion of the mitochondrial genome, with mRNAs (gray, labeled) and tRNAs (black) annotated below. Panels show RNA-seq read coverage (gray) and mitoribosome profiling (Mitoribo-seq) read A-site density (orange) on heavy (+) and light (−) strands. Y axis is in log scale. C Left panel: A-site density (orange) across a portion of MT-CO1 with subcodon position of maximum signal plotted below. Right panel: Percentage of reads with their A sites on each subcodon position across all mt-mRNAs. D Mitoribosome occupancy across codons. Asp, Leu (UUR), and termination codons are labeled. AGA and AGG Ter* putative termination codons are each present only once (indicated in parentheses), at the ends of MT-CO1 and MT-ND6, respectively. R: purine (A or G). Codons with occupancy of >3× expected are labeled. Error bars show range across replicates. E Percentage of processed and unprocessed MT-ATP8/6-CO3 transcript at site indicated by arrowhead and of translation (Tln) initiation on processed and unprocessed transcript. Numbers at top of bars indicate the fold-preference for translation initiation on unprocessed vs processed transcripts. Error bars show range across replicates. F Scatterplots to visualize mitoribosome position during initiation. Start-codon-aligned RPF 5′ and 3′ ends are plotted according to their genome position and read length. Arrowheads highlight MT-CO3 initiation on both unprocessed MT-ATP8/6-CO3 and processed MT-CO3 mRNA. Cartoon shows positioning of mitoribosome E, P, and A sites on a full-length (31 nt) RPF. Short 5′ leaders consist of one to three nts

