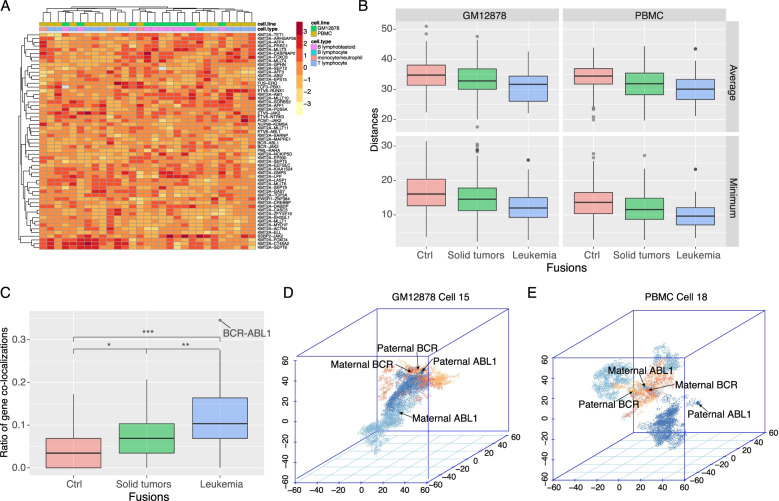
Fig. 1.
Single-cell Hi-C revealed that leukemia fusion partner genes are closer to each other in the nucleus. A Heatmap of spatial distances of different fusion gene pairs across single cells. Rows represent fusions, and columns represent different cells. B Comparison of average and minimum Euclidean distance (EuD) values of fusion gene pairs between leukemia, solid tumors, and control. C Comparison of the colocalization ratios of fusion partners between leukemia, solid tumors, and controls. D, E The spatial locations of BCR and ABL1 alleles in the 3D nucleus of two single cells (GM12878 cell 15 and PBMC cell 18), both paternal and maternal alleles, are marked. The statistical tests in B and C are Wilcoxon rank-sum test

