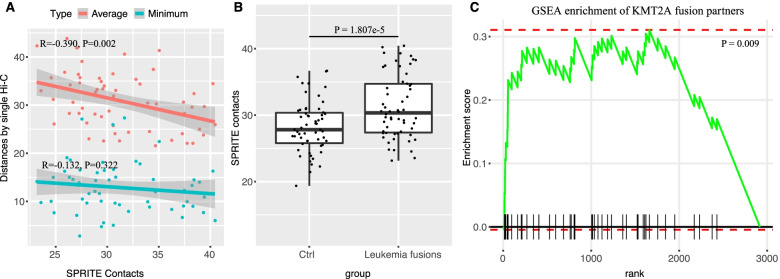
Fig. 3.
SPRITE verified that leukemia fusion partners are in close proximity. A Correlation between the spatial distances of fusion partners measured using single-cell Hi-C and the number contacts measured using SPRITE (more contacts mean closer spatial distance). For the Hi-C data, both average and minimum values over single cells are used. B Fusion partners exhibit higher numbers of SPRITE contacts than control (Wilcoxon rank-sum test). C GSEA results indicate that KMT2A partners are significantly enriched in regions closer to KMT2A (P-value=0.009)

