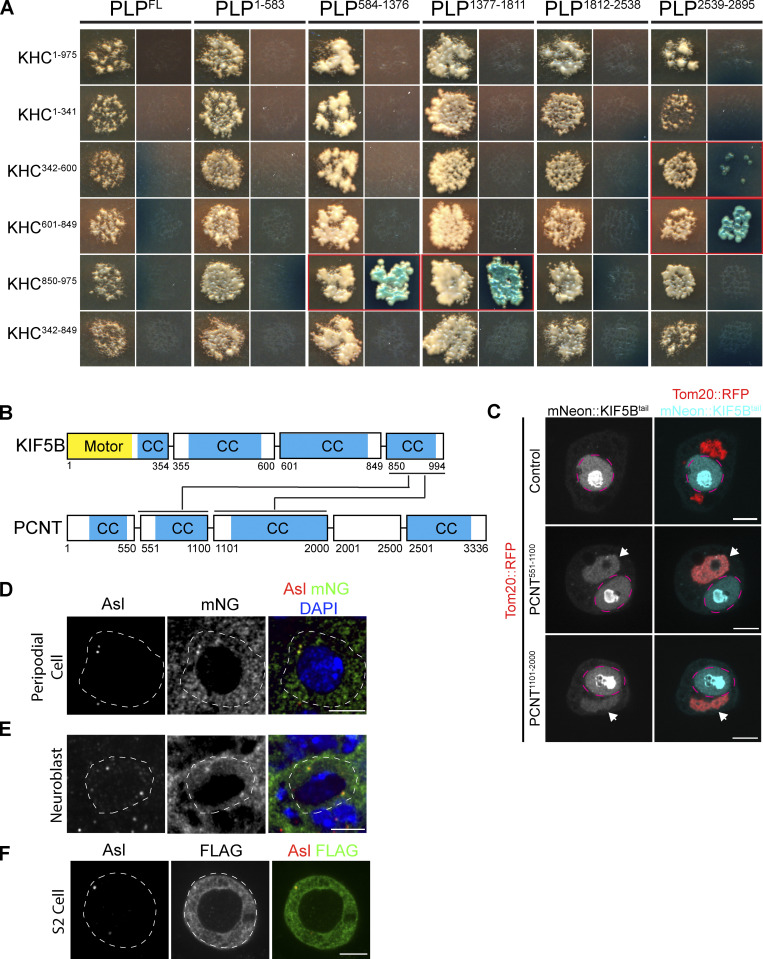
Figure S3.
PLP–Kinesin-1 interaction is conserved. (A) Images of mated yeast clones. For each PLP fragment, the left column is DDO plates to select for both bait and prey. Right column is QDOXA plates to select for interaction. Red outlined clones indicate a positive interaction, identified by the growth of blue yeast colonies. (B) Diagram illustrating interactions identified between human KIF5B and PCNT fragments, predicted coiled coils are highlighted in blue (CC). (C) Example images of S2 cells in which fragments of PCNT (Red) have been targeted to the mitochondria by a Tom20 mitochondrial targeting sequence. The KIF5B tail (aa850-994) was tagged with mNeonGreen. Note that KIF5B is only recruited to mitochondria in the presence of PCNT fragments (arrow heads) indicative of interaction. mNeon::KIF5B also accumulated in the nucleus (magenta dashed line). (D) Representative image of a peripodial cell expressing mNG::KHC. Note mNG signal (green) coincident with the centriole marker Asterless (red). (E) Representative image of an interphase NB expressing mNG::KHC. mNG::KHC localizes to both the apical and the basal centriole. (F) Representative image of an S2 cell expressing FLAG::KHC stained for FLAG and Asterless. Scale bar: 5 μm.

