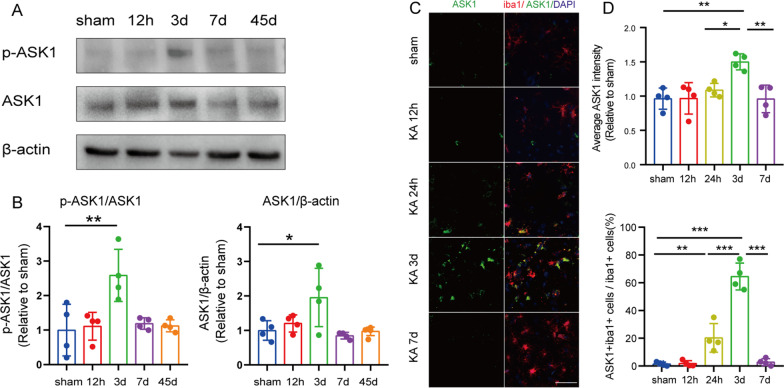
Fig. 1.
The expression of ASK1 from 12 h to 45 d in epileptic mice. A Representative bands of the Western blot in the ipsilateral hippocampus. B Quantitation of phosphate-ASK1 and total ASK1 expression of ipsilateral hippocampus in Western blot. C Representative images of ASK1 (green) in Mi/Mϕ (Iba1, red) immunofluorescence staining following different timepoints (12 h, 1d, 3d, 7d). Scale bar = 50 µm. D Quantitation of ASK1 intensity of staining and the percentage of ASK1+Iba1+ cells. All data are expressed as the mean ± SD and analyzed using the one way ANOVA. ***p < 0.001, **p < 0.01, and *p < 0.05, vs. sham group. n = 4/group

