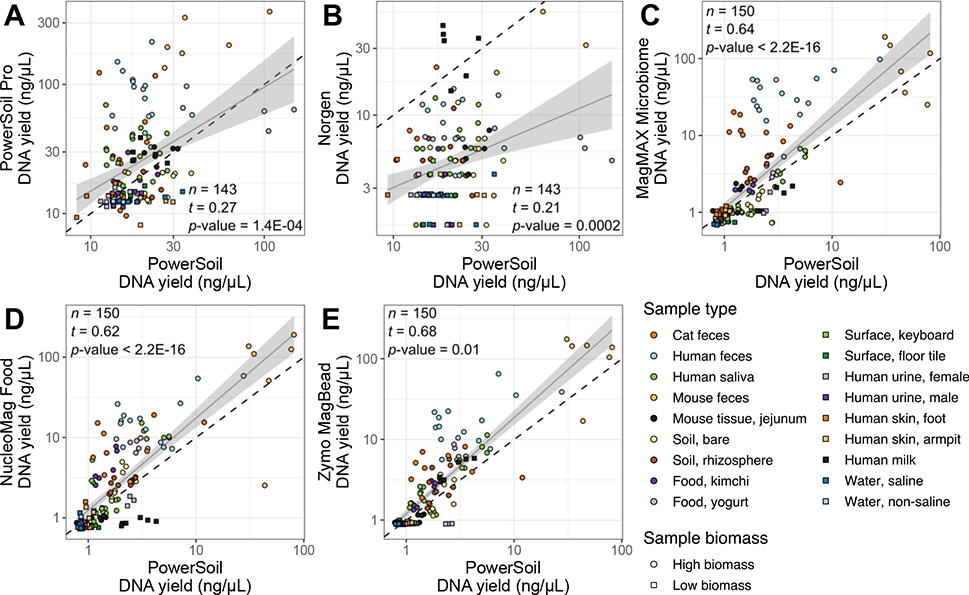
Figure 1.
DNA yield (ng/μL) per sample for each candidate extraction kit (y-axis) as compared to our standardized protocol (x-axis). (A) PowerSoil Pro. (B) Norgen Stool. (C) MagMAX Microbiome. (D) NucleoMag Food. (E) Zymo MagBead. For all panels, colors indicate sample type and shapes sample biomass, and dotted gray lines indicate 1:1 relationships between methods. Results from tests for correlation between per-sample DNA yield for each respective candidate kit vs. from our standardized protocol, are shown (t = Kendall’s tau). For significant correlations, results from a linear model including a 95% confidence interval for predictions are shown. Both axes are presented in a log10 scale. A miniaturized, high-throughput Quant-iT PicoGreen dsDNA assay was used for quantification, with a lower limit of 0.1 ng/μL. Yields below this value were estimated by extrapolating from a standard curve.

