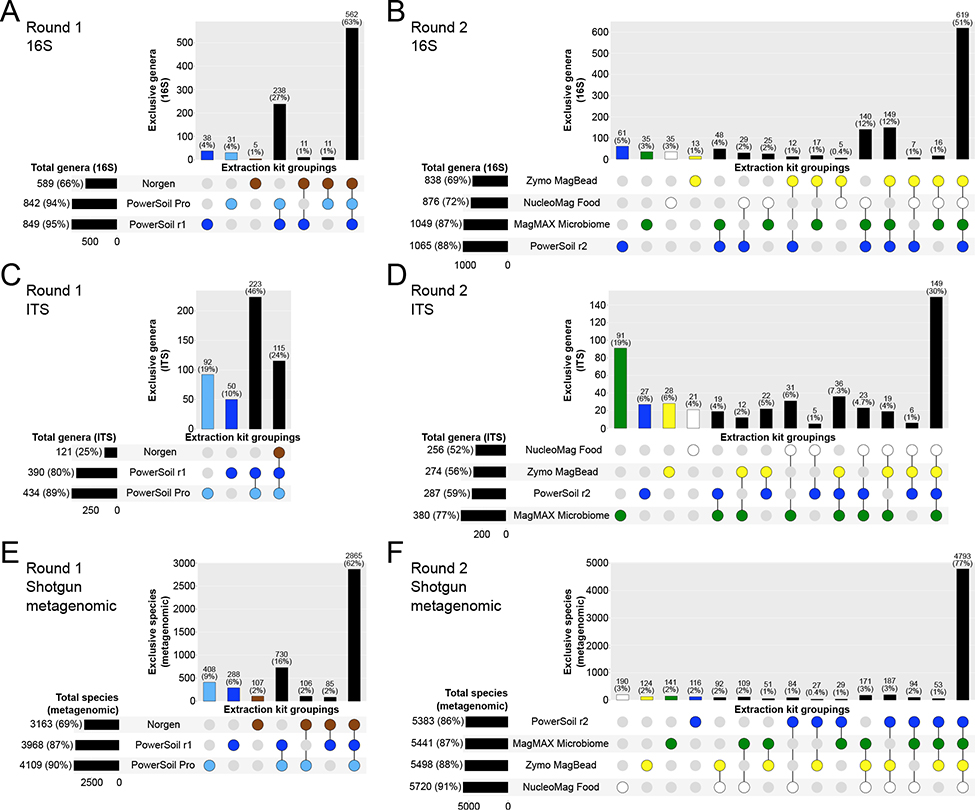
Figure 4.
Taxonomic bias among extraction protocols. Upset plots showing (A, B) genera for bacterial/archaeal 16S data, (C, D) genera for fungal ITS data, and (E, F) species for bacterial/archaeal metagenomics data, highlighting taxa shared among extraction protocols. Values indicate counts and percentages are respective to all taxa across all protocols. Associations representing <5 taxa were excluded for clarity. Round 1 and Round 2 indicate different sequencing runs, and because sampling effort was not normalized here such to compare absolute taxon counts, comparisons of counts (i.e., vs. percentages) should not be made across sequencing runs.

