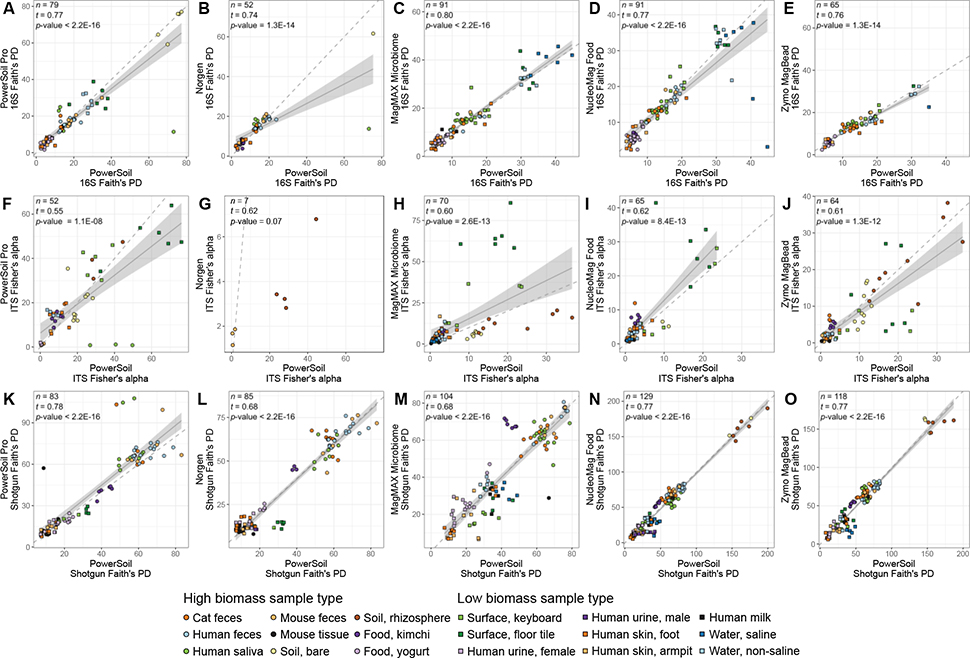
Figure 6.
Alpha-diversity per sample across sample types for each candidate extraction kit (y-axis) as compared to our standardized protocol (x-axis). (A-E) 16S data. (F-J) Fungal ITS data. (K-P) Shotgun metagenomic data. For each panel, colors indicate sample type and shapes sample biomass, and dotted gray lines indicate a 1:1 relationship between methods. Results from tests for correlation between alpha-diversity values from each respective candidate kit vs. from our standardized protocol, are shown (t = Kendall’s tau). For significant correlations, results from a linear model including a 95% confidence interval for predictions are shown. Sample types absent from any panel lacked representation by the respective candidate extraction kit and our standardized protocol.

