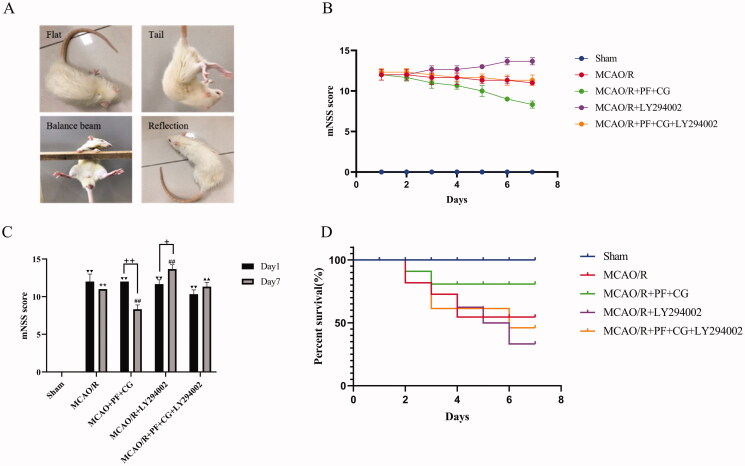
Figure 2.
mNSS score results. (A) Schematic representation of neurological function. (B) Changes of neurological scores after seven days. (C) Statistical comparison of neurological scores between the 1st and the 7th day. (D) MCAO/R rats’ survival curve. Results are expressed as mean ± SD (n = 6) and are compared with the sham group. ▼▼ p < 0.01. ** p < 0.01 compared with the sham group on the 7th day. # p < 0.05. ## p < 0.01 compared with the first day + p < 0.05. ++ p < 0.01 compared with theLY294002 group on the 7th day. ▲▲ p < 0.01.

