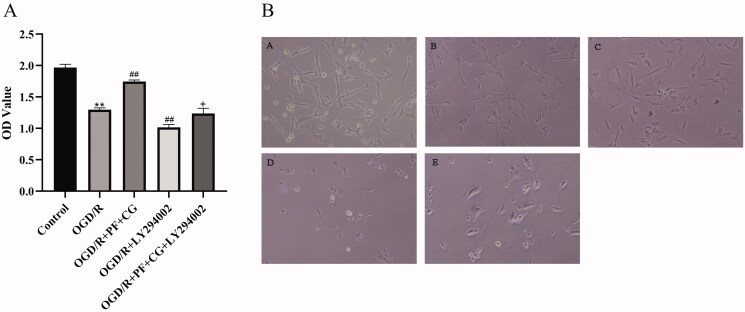
Figure 5.
Effect of PF + CG on the viability of OGD/R cells. (A) CCK-8 measurement results. (B) Cell morphology of controls (A) Control (B) OGD/R (C) OGD/R + PG + CG (D) OGD/R + LY294002 (E) OGD/R + PF + CG + LY294002 groups. Results are expressed as mean ± SD and are compared with the sham group. *p < 0.05. **p < 0.01 compared with the MCAO/R group. #p < 0.05. ##p < 0.01 compared with the LY294002 group. +p < 0.05. ++p < 0.01.

