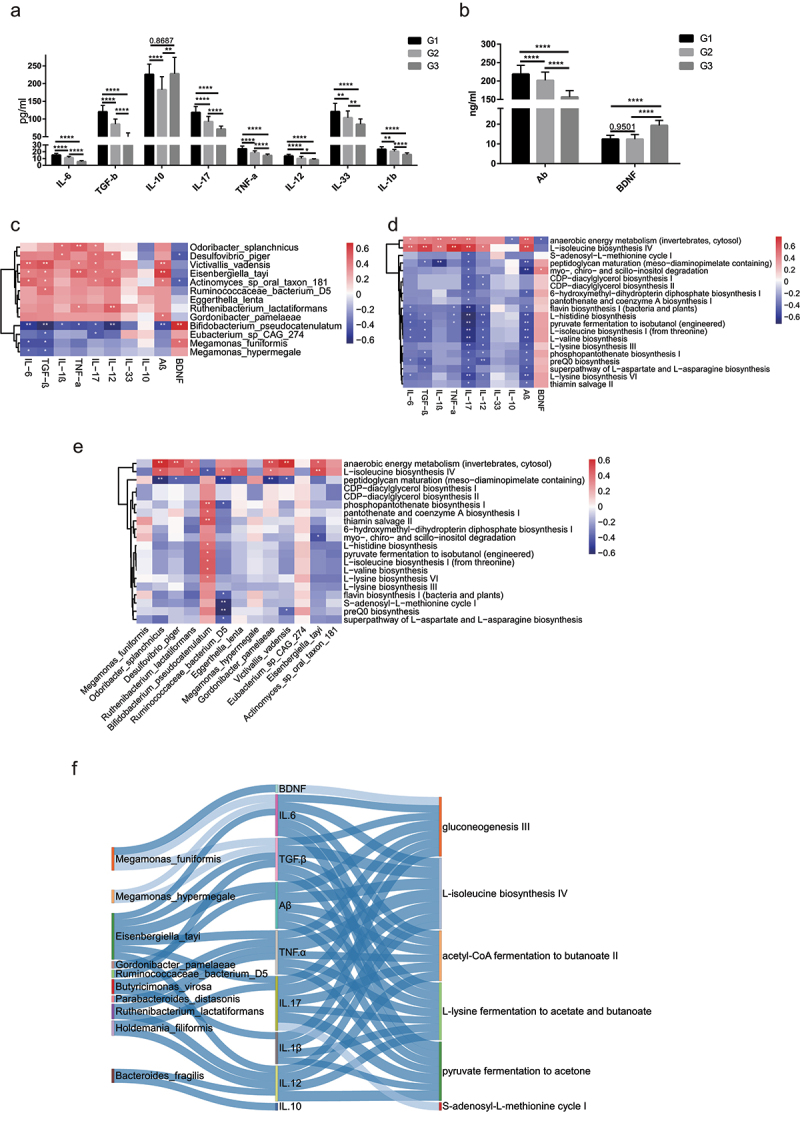
Figure 6.

Associations between species, immune cytokines and pathways. (a-b). Analysis of the level of eight immune cytokines, Aβ, and BDNF in G3, G2 and G1 groups. Serum of all subjects was collected and detected by ELISA. The differences were calculated by t-test (*p < .05, **P < 0 .01, ***P < .005, ****P < .001). (c). Heatmap of associations between species and cytokines. (d). Heatmap of associations between MetaCyc pathways and cytokines. (e). Heatmap of associations between species and MetaCyc pathways. (f). Correlation between species, serum cytokines and MetaCyc pathways based on the Spearman correlation algorithms according to the metagenomic sequencing data (Benjamini–Hochberg-corrected P value < .05). Only the top 20 significantly different species and pathways between G2 and G1 individuals were used to calculate the correlation. In (c-e), only the top 20 significantly different species and MetaCyc pathways between G3 and G1 individuals were used to calculate correlation according to the metagenomic sequencing data. Spearman correlation, *p-value<0.05, **p-value<0.01.
