Table 3.
Metabolic (metabolic syndrome/diabetes) and immune specificities. Comparative analysis between C. elegans, Drosophila, zebrafish, rodents, pigs and humans.
C. elegans
|
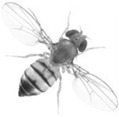
Drosophila
|
Zebrafish
|
Rodents
|
Pig
|
Human
|
|
| DIO/obesity/IR/diabetes model | DIO/diet restriction Accumulates fat/IR-like/IGF-1 like pathway Measurements: life expectancy Lipids accumulation (TG, lipid droplets staining) Mol. biol. methodologies ++ Insulin-like pathway No control of quantity ingested Control of type of food given |
DIO/diet restriction Accumulates fat/IR-like/ insulin producing neurons /IGF-1 like pathway Measurements: life expectancy, body weight, body composition, hormonal profiles Lipids accumulation (TG, lipids staining) Mol. biol. methodologies +++ Insulin-like pathway/trehalose No control of quantity ingested Control of type of food given |
DIO/diet restriction Accumulates fat/IR-like /β cells/IGF-1 like pathway Measurements: life expectancy, body weight, body composition, hormonal profiles Lipids accumulation (TG, lipids staining in larvae) Mol. biol. methodologies + Insulin pathway/glucose Complex control of intake Control of type of food given |
DIO/diet restriction Accumulates fat/IR/β cells Many monogenic or polygenic models of diabetes or obesity Measurements: life expectancy, body weight, tissues weight, body composition, hormonal profiles Lipids accumulation in body and tissues (TG, histology) Mol. biol. methodologies ++ Insulin signaling /glucose, OGTT, ITT, HOMA-IRControl of intake Control of type of food given |
DIO/diet restriction Accumulates fat/IR/β cells Some monogenic or polygenic models of diabetes or obesity Measurements: life expectancy, body weight, tissues weight, body composition, hormonal profiles Lipids accumulation in body and tissues (TG, histology), Mol. biol. methodologies, Insulin signaling /glucose, OGTT, ITT, HOMA-IR Control of intake Control of type of food given |
DIO/diet restriction Accumulates fat/IR/β cells Measurements: body weight, body composition, hormonal profiles Lipids accumulation in body and tissues (TG, histology) Mol. biol. methodologies, insulin signaling /glucose, OGTT, ITT, HOMA-IR Assessment of intake (intake controlled in some controlled interventional studies) |
| Immunity | Innate/no adaptive immunity/lack of cell mediated immunity Main receptors/Innate immunity:TOL-1 (Toll homolog) No NLROther: CTLD, GPCRs |
Innate/no adaptive immunity Main receptors/Innate immunity:9 Toll homologs, most pathogen defense relies on Toll-1, MyD88 No NLR Other: CTLD, PGRP, SR (CD36), GPCRs |
Innate/late adaptive /cell-mediated immunity Main receptors/Innate immunity: TLR 1–5, 7–9, 14,18–22 NLRs Other: RLR, PGRP, GPCRs |
Innate/adaptive/cell mediated immunity Main receptors/Innate immunity: TLR 1–9, 11–13, MyD88 NLRs (NOD1, NOD2) Other: CTLD, RLR, PGRP, SR (CD36), GPCRs |
Innate/adaptive/cell mediated immunity Main receptors/Innate immunity: TLR 1–10, MyD88 NLRs (NOD1, NOD2) Other: CTLD, RLR, PGRP, SR (CD36), GPCRs |
Innate/adaptive/cell mediated immunity Main receptors/Innate immunity: TLR 1–10, MyD88 NLRs (NOD1, NOD2) Other: CTLD, RLR, PGRP, SR (CD36), GPCRs |
Abbreviations: DIO: Diet induced obesity, IR: insulin resistance, IGF-1: Insulin growth factor −1, TG: triglyceride, mol. biol. molecular biology, OGTT: oral glucose tolerance test, ITT: insulin tolerance test, HOMA-IR: Homeostasis model assessment -insulin resistance, TLR: Toll like receptor, NLR: Nod like receptor, CTLD (C-type lectin receptors), RIG-like helicase receptors, PGRP: Peptidoglycan recognition proteins, SR: scavenger receptors, GPCRs: G protein receptors,
