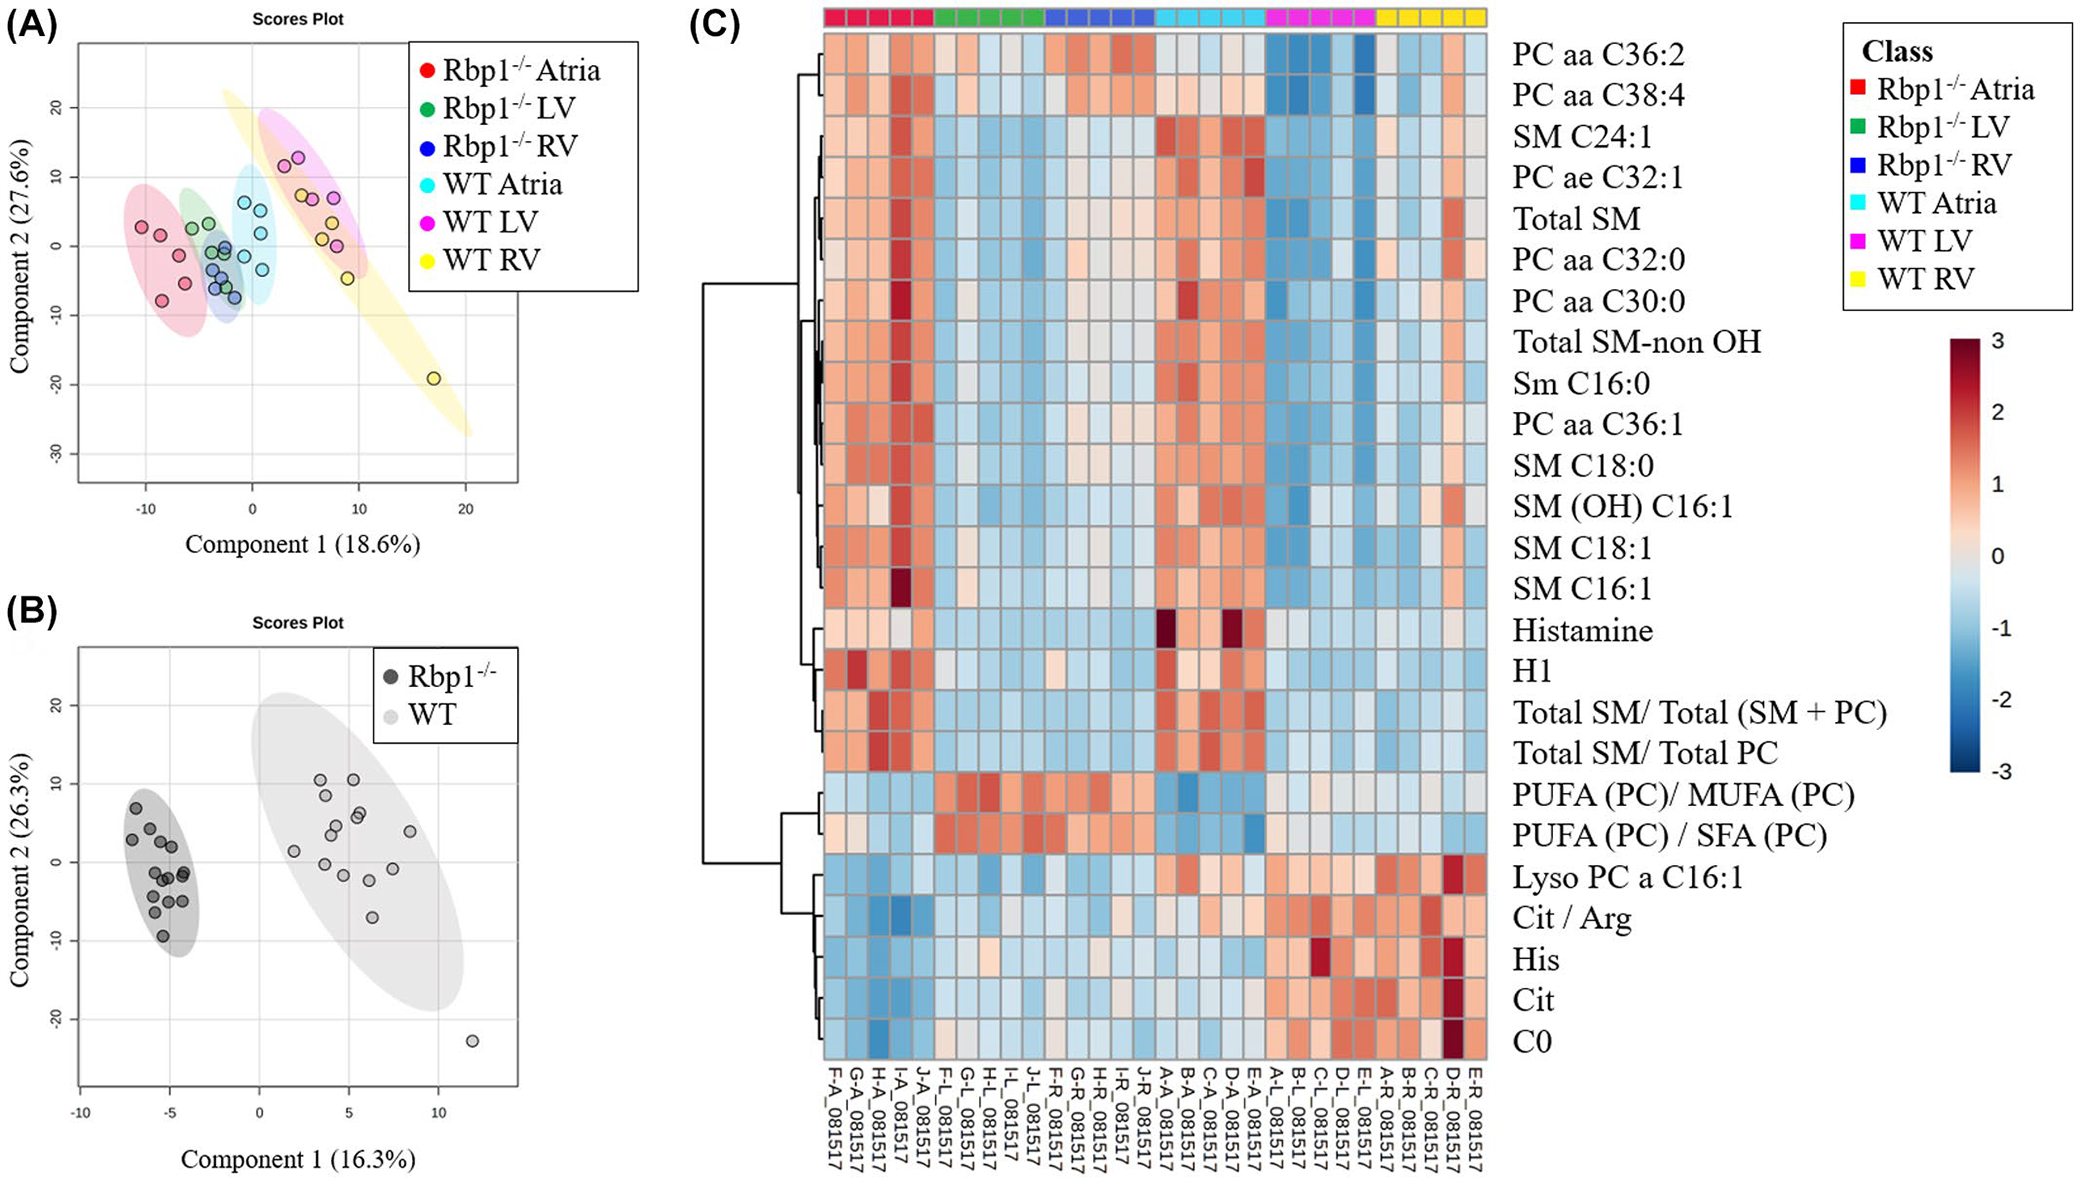
FIGURE 2.

Multivariate analysis and hierarchical clustering displays statistical metabolite differences between WT and Rbp1−/− mice atria, LV and RV. (A) PLS-DA plot comparing Rbp1−/− Atria (Red), Rbp1−/− LV (Green), Rbp1−/− RV (Blue), WT Atria (Cyan), WT LV (Magenta), WT RV (Yellow). R2 = 0.98. Q2 = 0.91. N = 5 per group. Each point represents a data set from an individual animal tissue. The 95% confidence intervals are indicated by elliptical patterns per group. (B) PLS-DA plot comparing all Rbp1−/− samples (black) and WT samples (gray). R2 = 0.99. Q2 = 0.96. n = 15 per group. The 95% confidence intervals are indicated by elliptical patterns per group. (C) Heatmap displaying the top 25 metabolites based on t-test/ANOVA, Euclidean distancing, and Ward clustering
