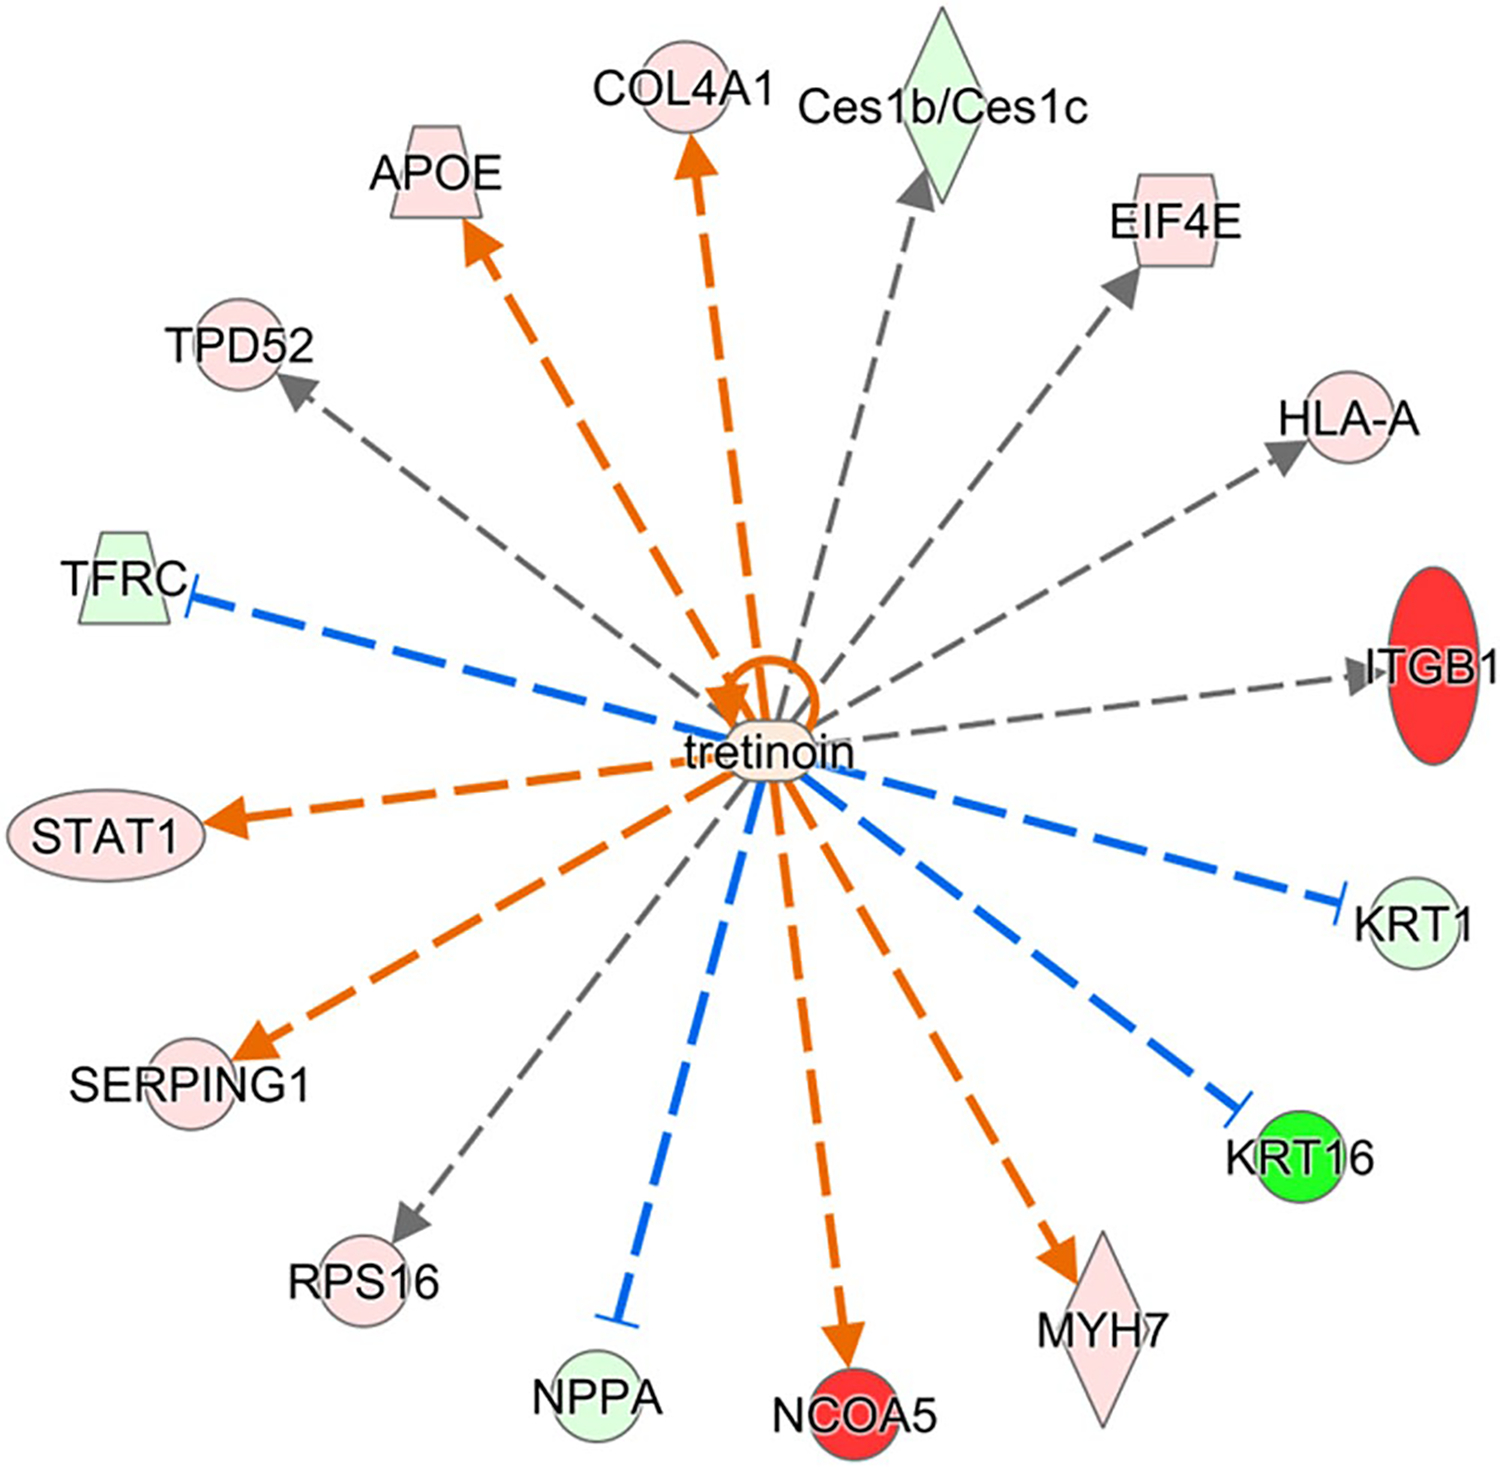
FIGURE 5.

Proteins in left ventricle regulated by retinoic acid and significantly perturbed in Rbp1−/−. Proteins with minimum 2-fold change and FDR adjusted p-value < .05 were selected for upstream regulator interference at a cutoff of Benjamini-Hochberg adjusted Fisher’s exact test p-value < .01. Red color indicates significant upregulation and green indicates downregulation, with intensity of color corresponding to magnitude of upregulation
