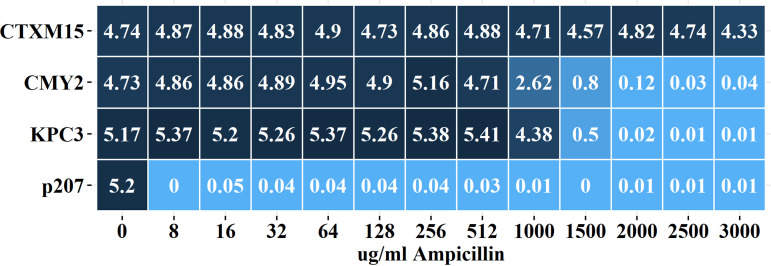
FIG 2.
Average area under the curve (AUC) values for E. coli cultures exposed to ampicillin. Heatmap depicts average AUC for growth curves from CTX-M-15-, CMY-2-, and KPC-3-producing strains of E. coli and for the plasmid-only negative-control strain (p207) in the presence of no antibiotic (3 independent replicates) or 8 to 3,000 μg/mL (3 independent replicates). See Fig. S2 in the supplemental material for original growth curves and P values for multiple comparison tests.

