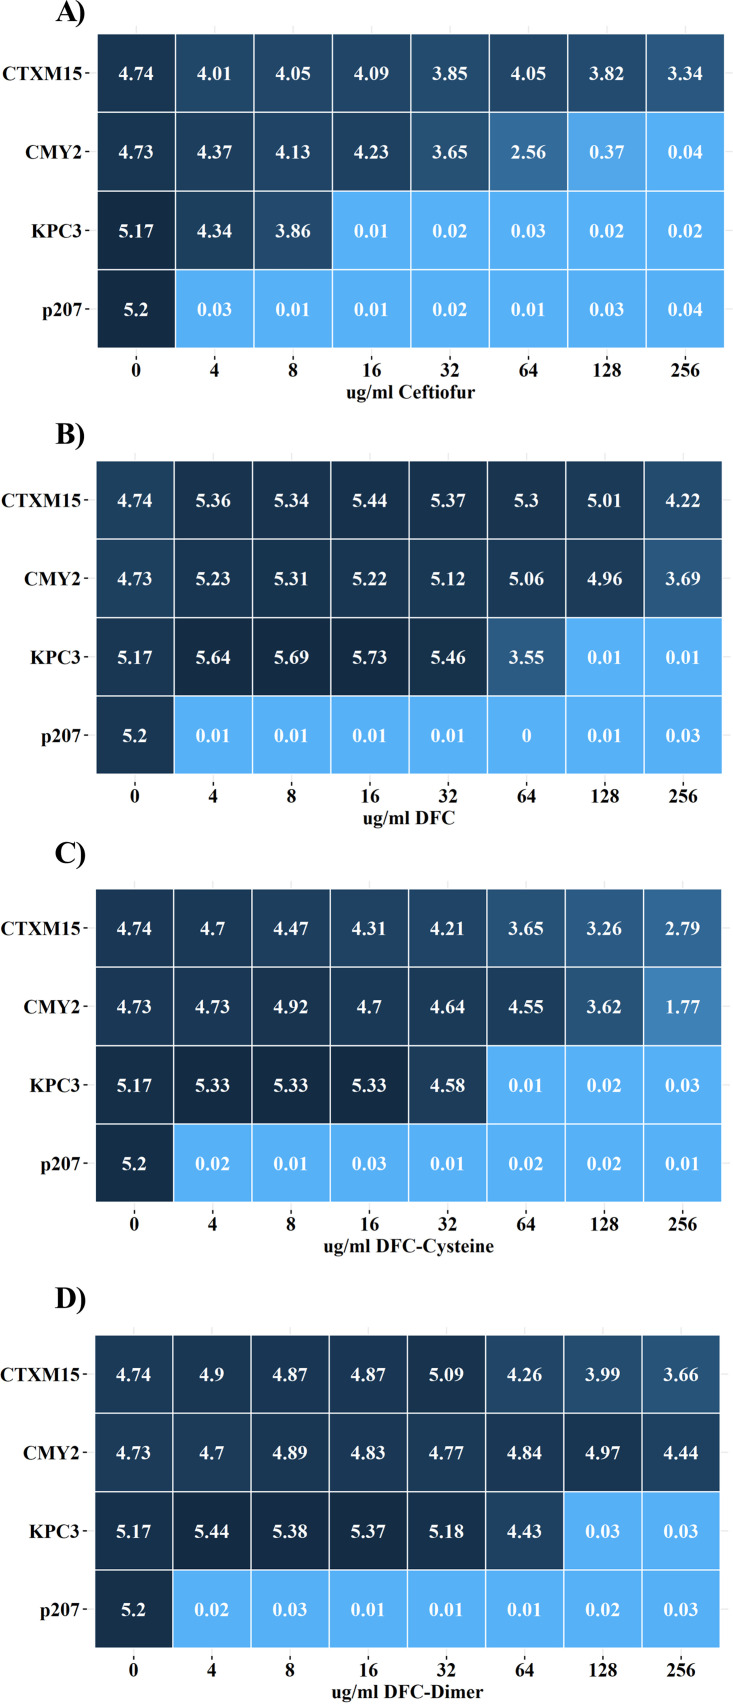
FIG 3.
Average area under the curve (AUC) values for E. coli cultures exposed to ceftiofur and its metabolites. Heatmap depicts average AUC for growth curves from CTX-M-15-, CMY-2-, and KPC-3-producing strains of E. coli and for the plasmid-only negative-control strain (p207) in the presence of 0 to 256 μg/mL ceftiofur (A), DFC (B), DFC-cysteine (C), or DFC-dimer (D). Values represent averages (3 independent replicates). See Fig. S3 to S6 in the supplemental material for original growth curves and P values for multiple-comparison tests.

