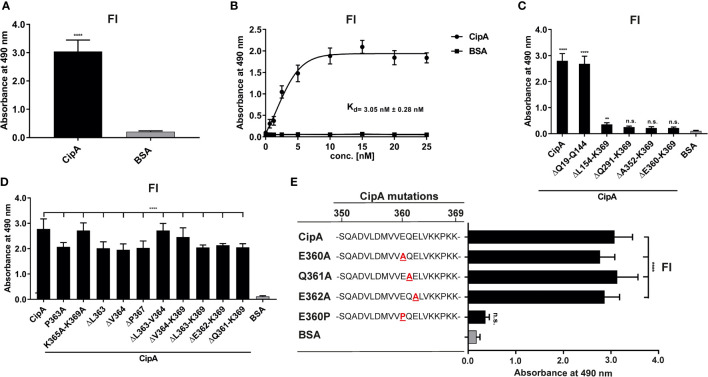
Figure 4.
Interaction of CipA with FI. Protein binding of FI to CipA was measured by ELISA (A). CipA-coated wells (5 ng/µl) were incubated with 5 ng/µl purified FI and protein complexes were detected using an anti-FI antibody (1:1,000). To assess statistical significance, one-way ANOVA with post-hoc Bonferroni multiple comparison test (confidence interval = 95%) was performed. Data represent means and standard deviation of at least three different experiments, each conducted in at least triplicate. ****, p ≤ 0.0001. Dose-dependent binding of FI to CipA (B). CipA (5 ng/µl) immobilized was incubated with increasing concentrations (0 to 25 nM) of purified FI and dissociation constant was approximated via non-linear regression, using a one-site, specific binding model. Data represent means and standard deviation of at least three different experiments, each conducted in triplicate. Detection of the FI-interacting region within CipA employing diverse CipA variants (C–E). Microtiter plates coated with CipA and CipA variants (5 ng/µl) were incubated with FI (10 ng/µl) and binding was detected by an anti-Fi antibody (1:1,000). BSA was used as negative control in all assays. Data represent means and standard deviation of at least three different experiments, each conducted in triplicate. **, p ≤ 0.05, ****, p ≤ 0.0001, n.s., no statistical significance, one-way ANOVA with post-hoc Bonferroni multiple comparison test (confidence interval = 95%).

