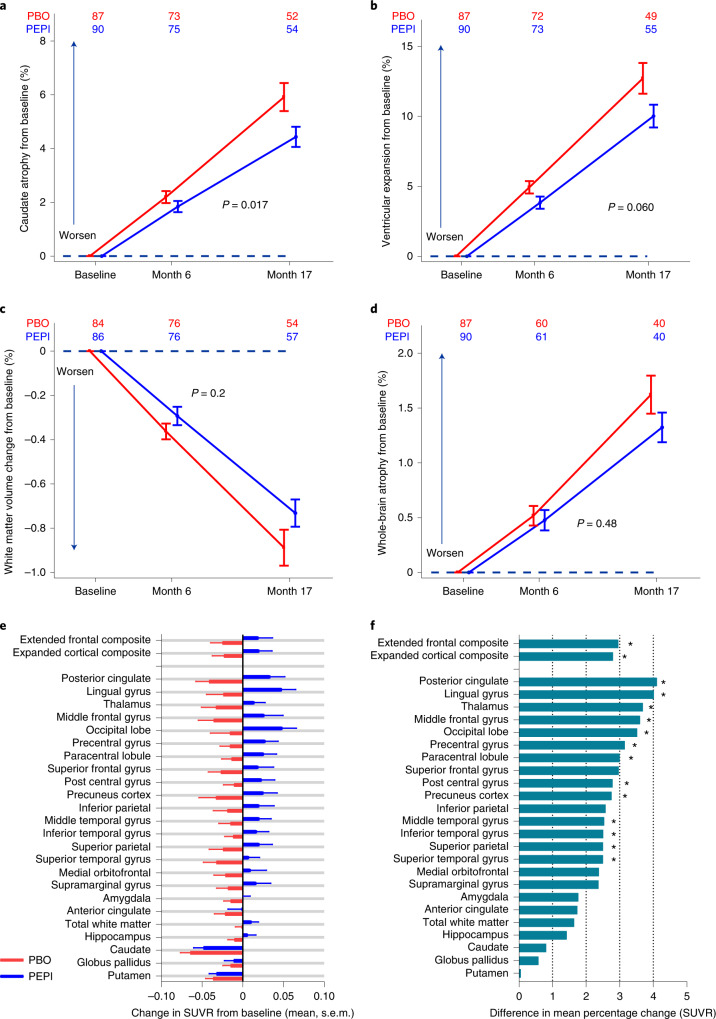
Fig. 2. Pepinemab delays brain atrophy and restores loss of metabolic activity in EM subjects.
a–d, Mean percentage changes from baseline by treatment group over time for the mITT sample of EM cohort B1 (PEPI, n = 90: PBO, n = 88) in vMRI measurement. a, Caudate BSI (atrophy); b, ventricular BSI (expansion); c, white matter (preservation); d, whole-brain BSI (atrophy). e, FDG–PET SUVR change from baseline to month 17 for each treatment group (mean and 1 s.d.) in each brain ROI for EM cohort B1. f. Treatment effect at month 17 calculated as difference between pepinemab (n = 40) and placebo groups (n = 36) as mean percentage change in SUVR. *P ≤ 0.05; exact two-sided P values for 15 brain regions (listed from top to bottom) are: extended frontal composite, 0.031; expanded cortical composite, 0.028; posterior cingulate, 0.008; lingual gyrus, 0.014; thalamus, 0.011; middle frontal gyrus, 0.033; occipital lobe, 0.029; precentral gyrus, 0.010, paracentral lobule, 0.014; post central gyrus, 0.028; precuneus cortex, 0.048; middle temporal gryus, 0.044; inferior temporal gyrus, 0.033; superior parietal, 0.050; superior temporal gyrus, 0.037; P values for all regions are shown in Extended Data Table 5. Analysis results were determined from MMRM of scheduled measurements at months 2, 6 and 17, with estimation of the difference in means between groups at month 17. P values are indicated (two-sided); as described in Methods, stated P values for all statistical tests, besides the coprimary efficacy analyses, were not corrected for multiplicity and are thus presented as nominal and not under alpha control. Error bars show one standard error on either side of the mean, with sample sizes at each time point for each group listed above the profile lines.

