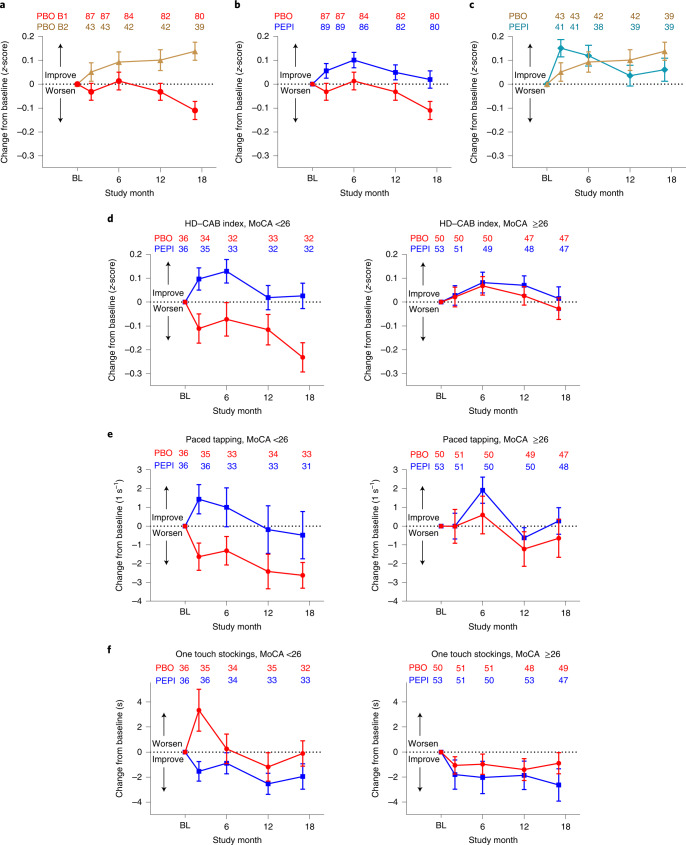
Fig. 3. Exploratory cognitive measures and post hoc subgroup analysis of baseline MoCA as a biomarker for treatment response in early HD.
a–c, Observed mean changes from baseline by treatment group over time for the placebo groups alone of cohort B1 (red circles) and B2 (brown triangles) (a), for both placebo and pepinemab treatment groups of EM cohort B1 (b) and LP cohort B2 (c). Cognitive assessments stratified by baseline MoCA scores of <26 and 26–30 for assessments of HD–CAB index (d), PTAP (e) and OTS (f). Error bars in each panel show one standard error on either side of the mean, with sample sizes at each time point for each group listed above the profile lines. PEPI (blue squares) and PBO (red circles) in EM cohort B1, and PEPI (teal diamonds) and PBO (brown triangles) in LP cohort B2.

