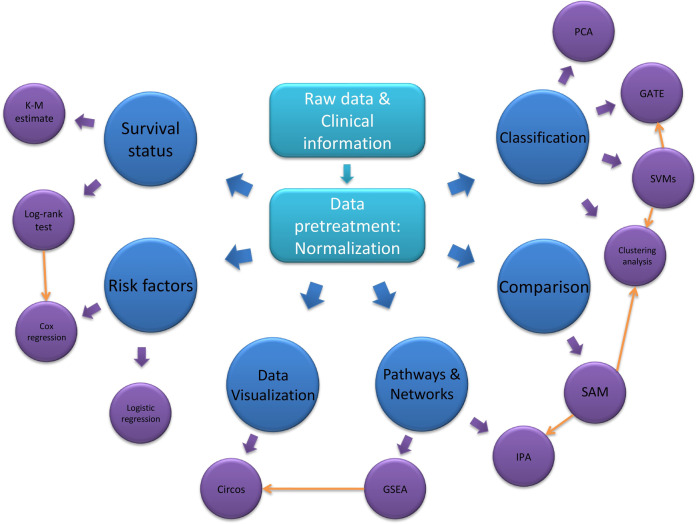
Fig. 2. The flow chart of data analysis.
Normalization is the most significant step after acquiring the raw data. Data can be analyzed according to specific study design and available clinical information and it can be based on the raw data after normalization or a result from other analyses. For example, the clustering analysis can be performed on raw data or the proteins that have significant changes after SAM.

