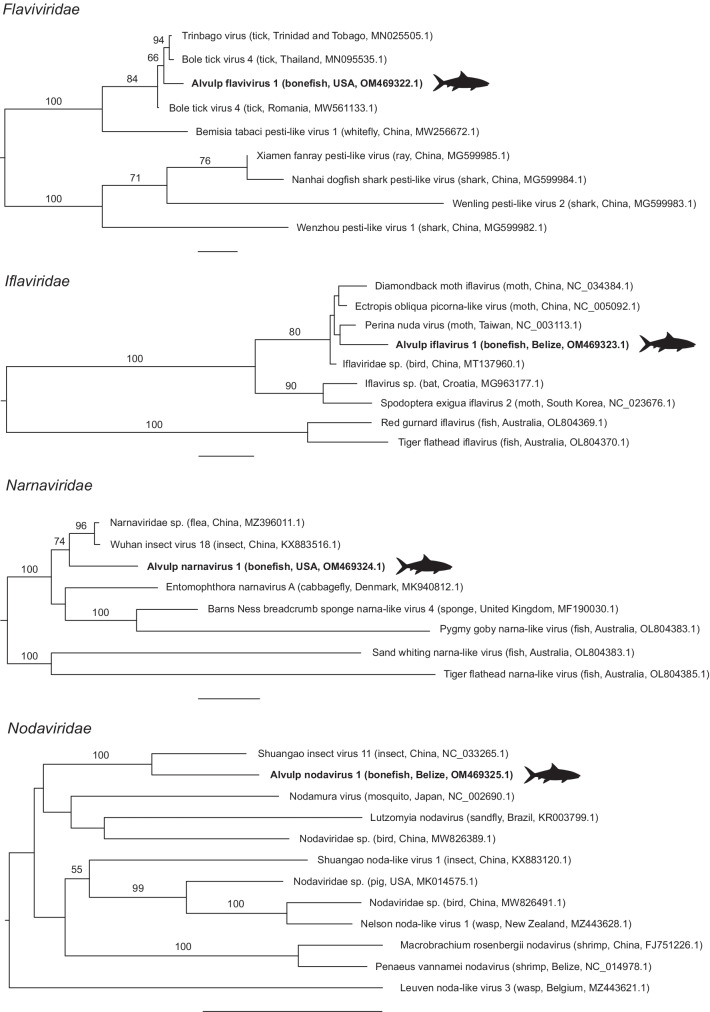
Fig. 2.
Maximum likelihood phylogenetic trees of bonefish viruses and their relatives in four virus families. Virus names are followed (in parentheses) by host, country, and GenBank accession number. Viruses identified in the present study are in bold with silhouettes. Numbers beside branches are bootstrap values based on 1000 replicates; only values ≥ 50% are shown. Scale bars = 0.5 substitutions per site

