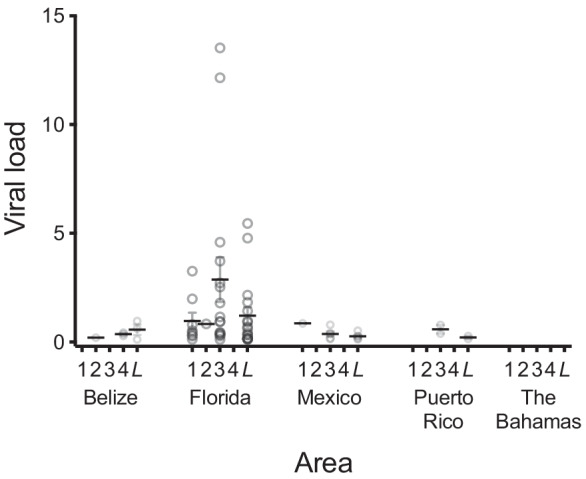
Fig. 5.

Viral load by area. Viral load is the intensity of infection of an individual fish with a given virus, expressed as the normalized number of sequence reads mapping to a given virus on a log10 scale (see text for further explanation), here multiplied by 1000 for clarity. Values for individual fish are represented by open circles, horizontal lines indicate means, and error bars indicate standard errors of the mean. Only virus-positive fish are included. Viruses are (1) alvulp flavivirus 1 (AvFLV-1); (2) alvulp iflavirus 1 (AvIFV-1); (3) alvulp narnavirus 1 (AvNAV-1); (4) alvulp nodavirus 1 (AvNOV-1); and (L) all viruses combined. Blank columns indicate lack of detection of a virus in that area. The two highest data points in Florida (column 3) are the outliers described in the main text. Viral load values are given in Online Resource 1
