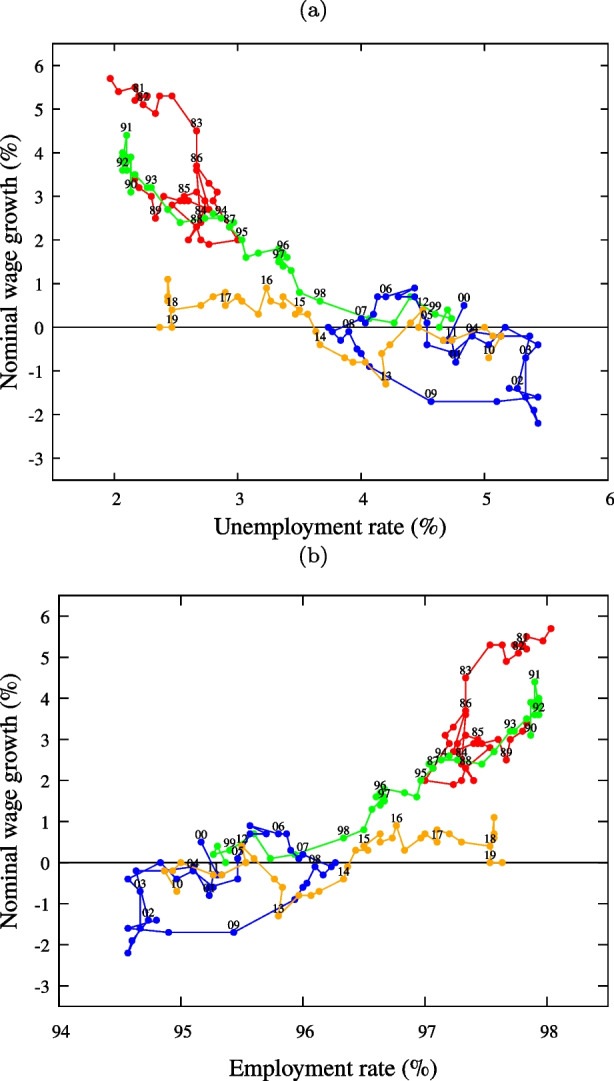
Fig. 2.

Japan’s wage Phillips curve: Unemployment rate and nominal wage growth of 157 quarters from 1980.π to 2019.π. (a) The abscissa represents the unemployment rate in %. (b) The abscissa is reversed and represents the employment rate (= 100-unemployment rate (%)). Colors: 1980s (red), 1990s (green), 2000fs (blue), 2010fs (orange). The last several years’ data (in yellow) show definite deviation from those of the earlier years, with low nominal wage growth despite of the low unemployment. Sources: (Ministry of Health Labor and Welfare 2020) and (Statistics Bureau of 2021)
