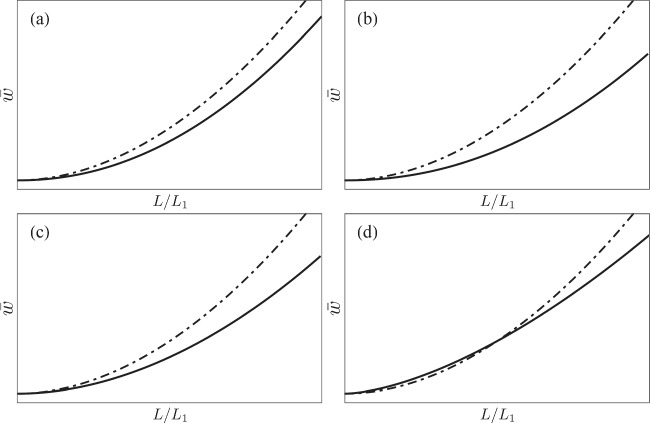
Fig. 6.
The parameter dependence of the wage Phillips curve. The dash-dotted curve is the same as the solid curve Fig. 4, with α = c = γ = β = 0.5. The numerical value of B is irrelevant to this figure, as we do not specify the scale of the vertical axis, and we just indicate it as B = B1. The solid lines in each panel are obtained by changing the value of one parameter as follows: (a) c is increased from 0.5 to 0.9; (b) γ is decreased from 0.5 to 0.2; (c) B is increased by 20%; (d) β is increased from 0.5 to 0.6.

